End-to-end Data Lineage, Model Health & AI Readiness for Power BI

One report that maps every source, table, column, measure, visual and page, and tells you what to fix.

pip install trailsbi
Sample Report

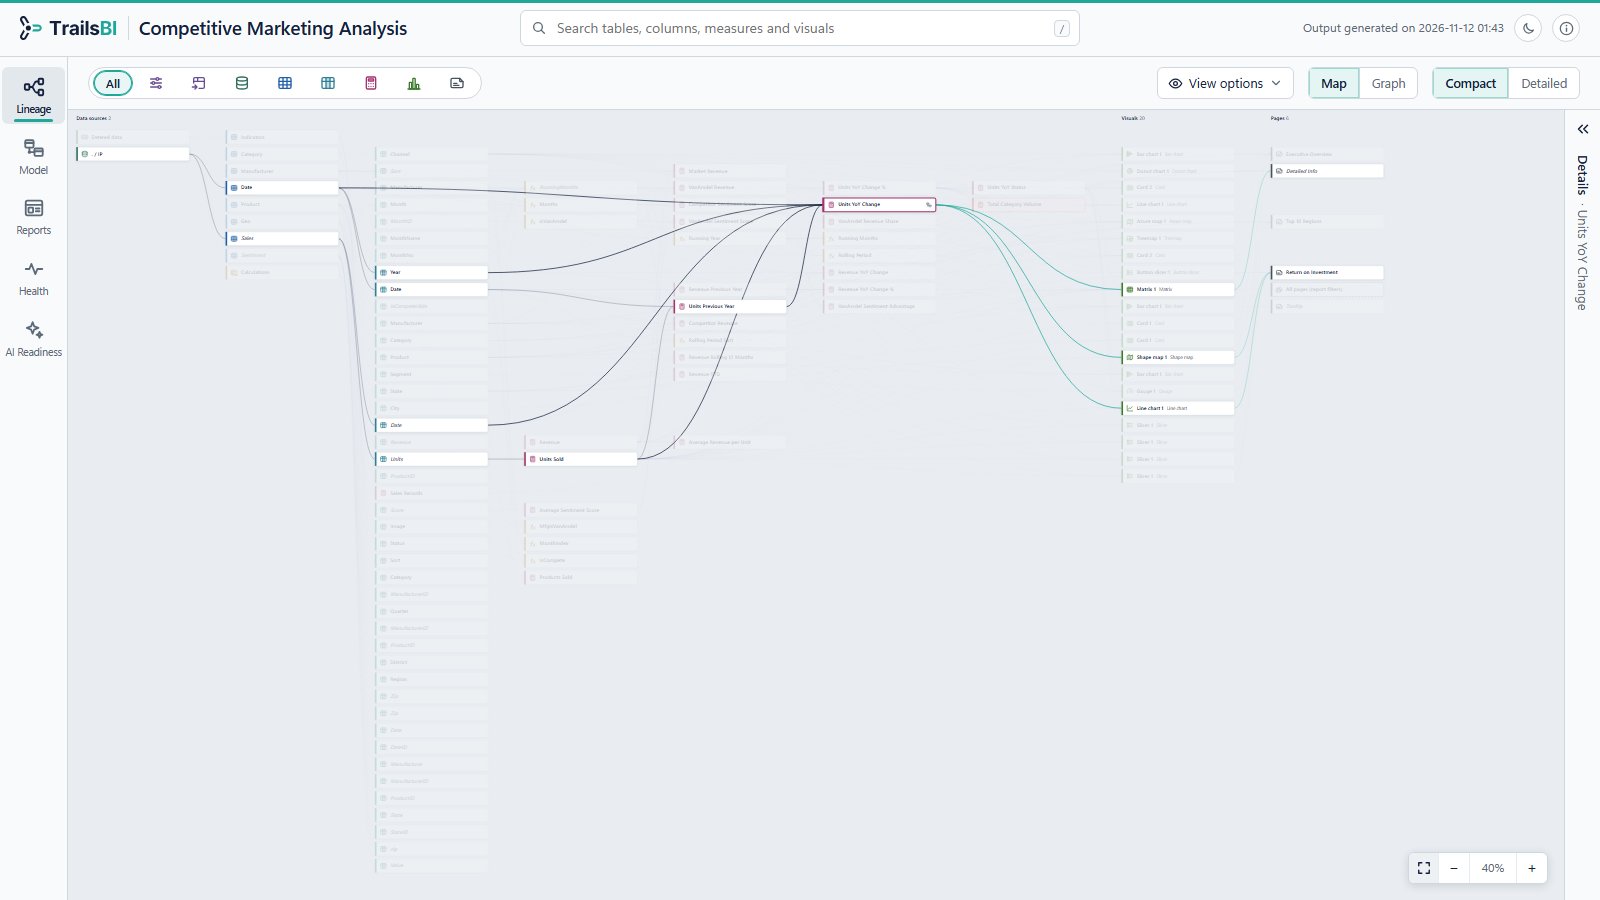
Where is Units YoY Change used?

Upstream what the measure reads

Sources
SQL Server
Tables
DateSales
Columns
Date table, DateDate table, YearSales table, DateSales table, Units
Measures
Units Previous YearUnits Sold
Units YoY Change

Downstream what uses the measure

Visuals
Matrix 1Line chart 1Shape map 1
Pages
Detailed InfoReturn on Investment
See it in Action

TrailsBI lineage view of Microsoft's Competitive Marketing Analysis sample with Units YoY Change selected: what it reads on the left, the visuals and pages that use it on the right
  1. The data source, then the tables, columns and measures the selected measure reads.
  2. The selected measure, Units YoY Change. Click any card to highlight its lineage.
  3. Every visual and page that would change if you edited it.

Analyze your Reports, The TrailsBI way

  1. Lineage

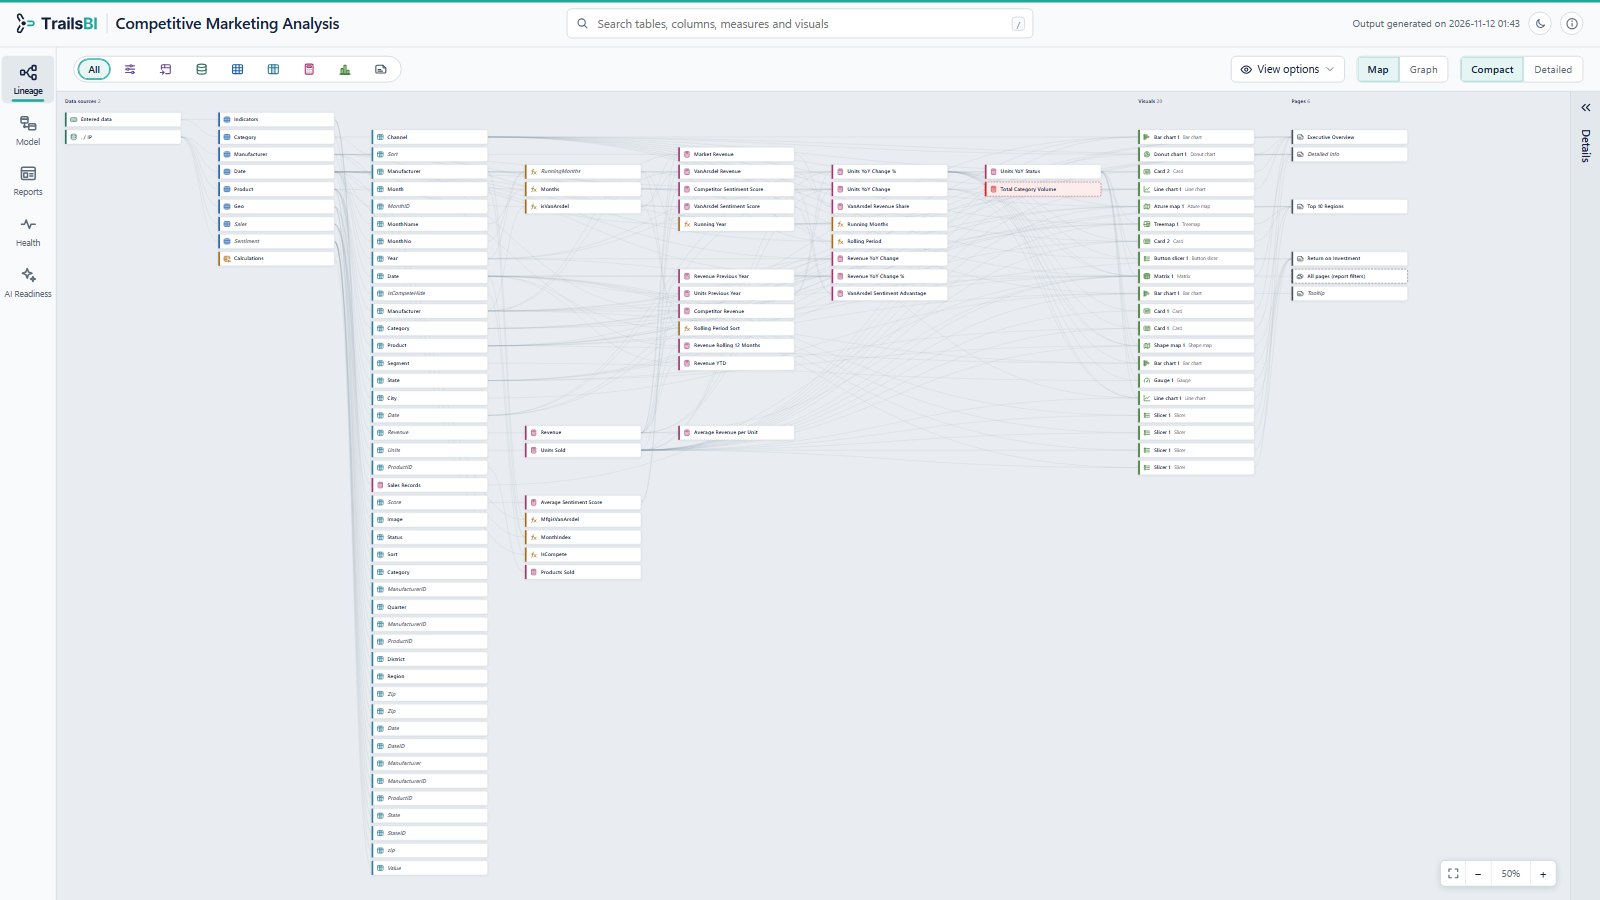
    Pick any column or measure and see what it depends on, and everything built on it, from source to visuals and pages.

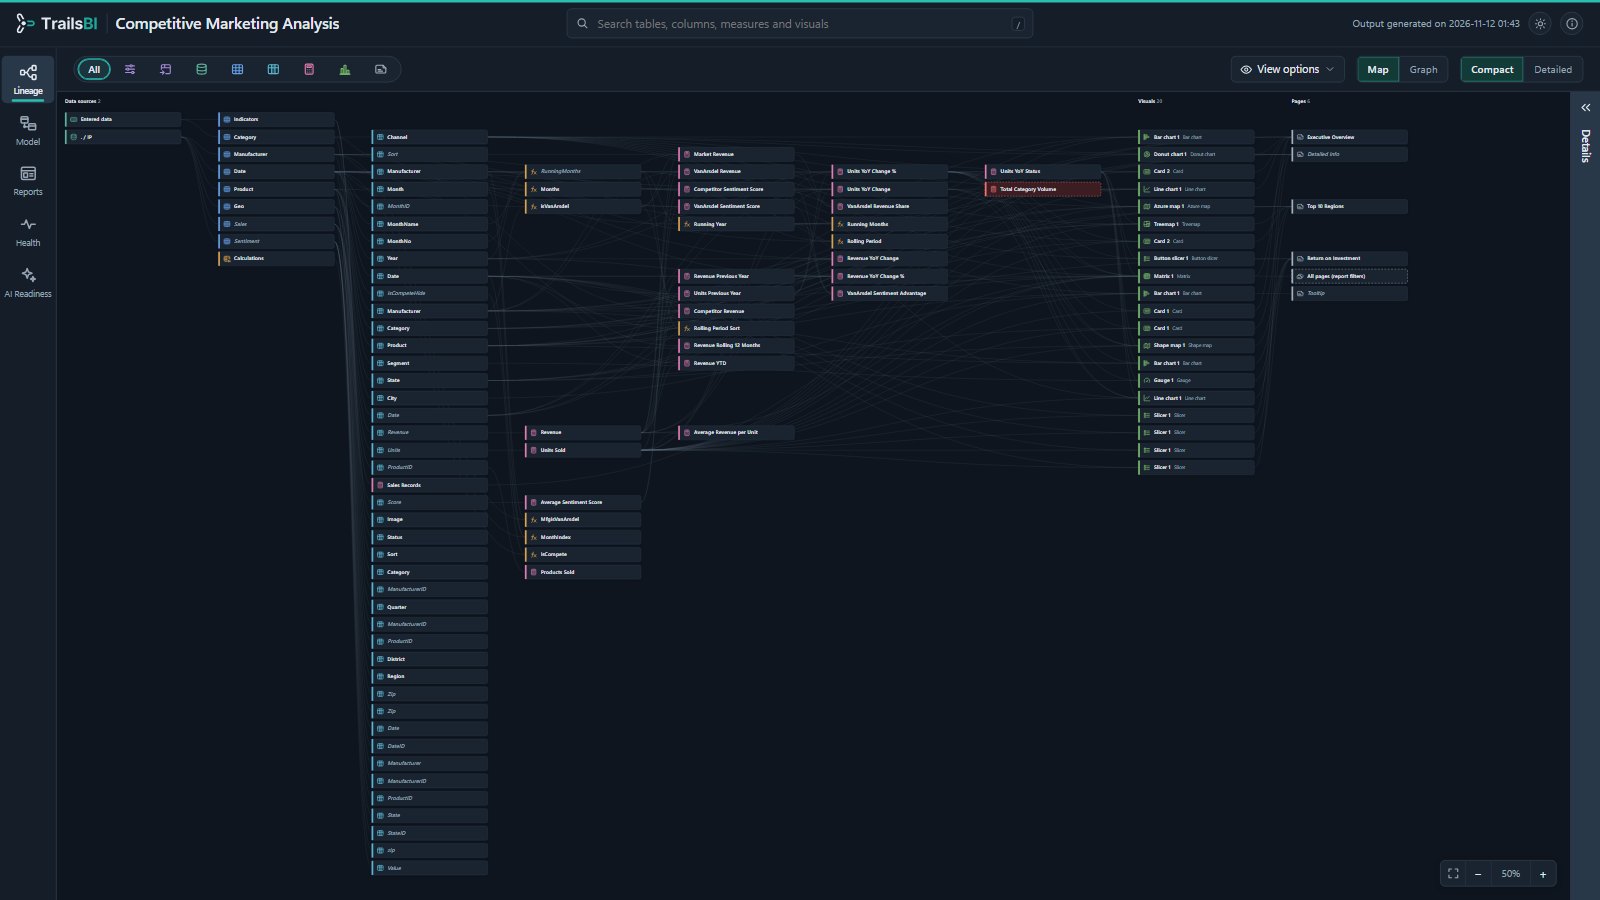
    TrailsBI Lineage view with compact cards, from the data sources to the visuals and pages, on Microsoft's Competitive Marketing Analysis sampleTrailsBI Lineage view with compact cards, from the data sources to the visuals and pages, on Microsoft's Competitive Marketing Analysis sample
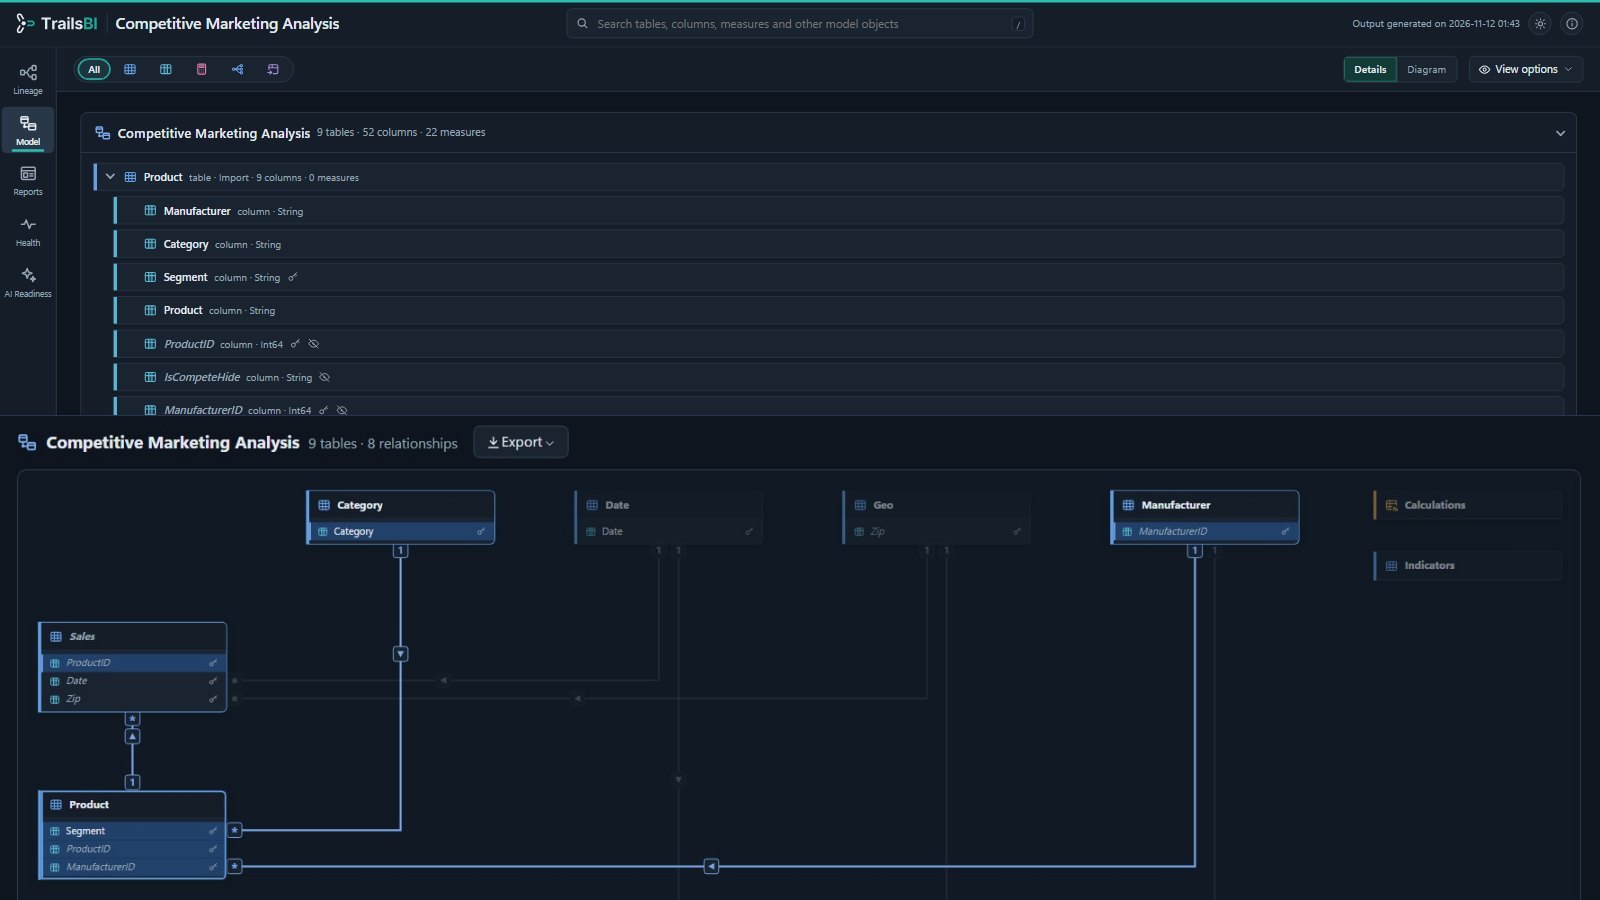
  2. Model

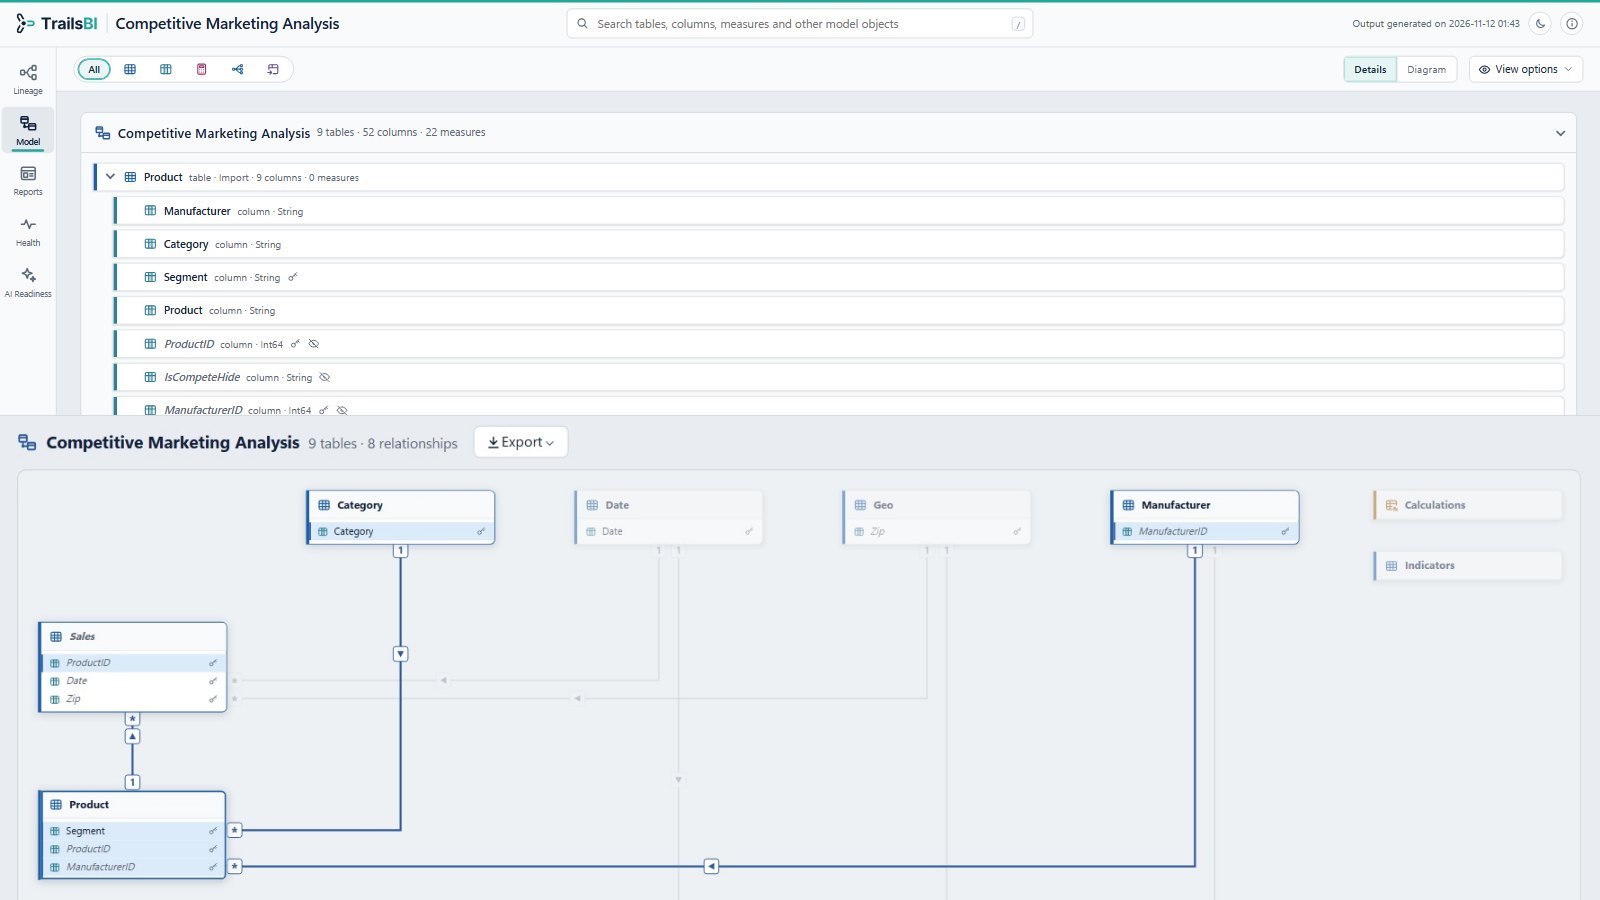
    Every table, column, measure and relationship in one searchable list, with the DAX and Power Query one click away.

    TrailsBI Model view on Microsoft's Competitive Marketing Analysis sample: the details list of tables and columns above the relationship diagramTrailsBI Model view on Microsoft's Competitive Marketing Analysis sample: the details list of tables and columns above the relationship diagram
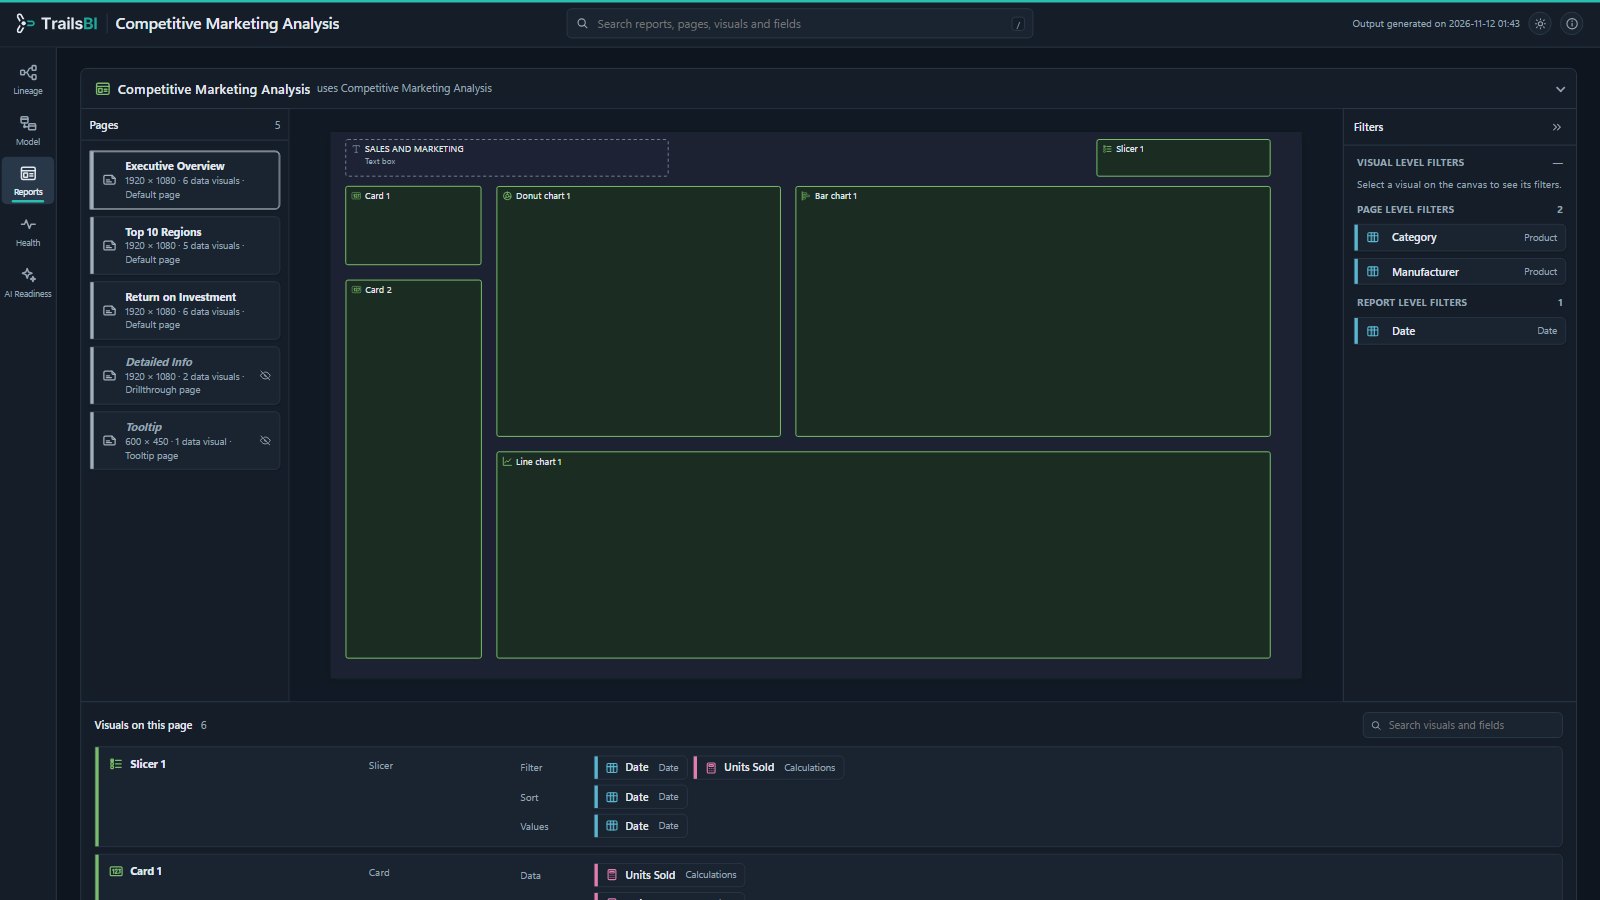
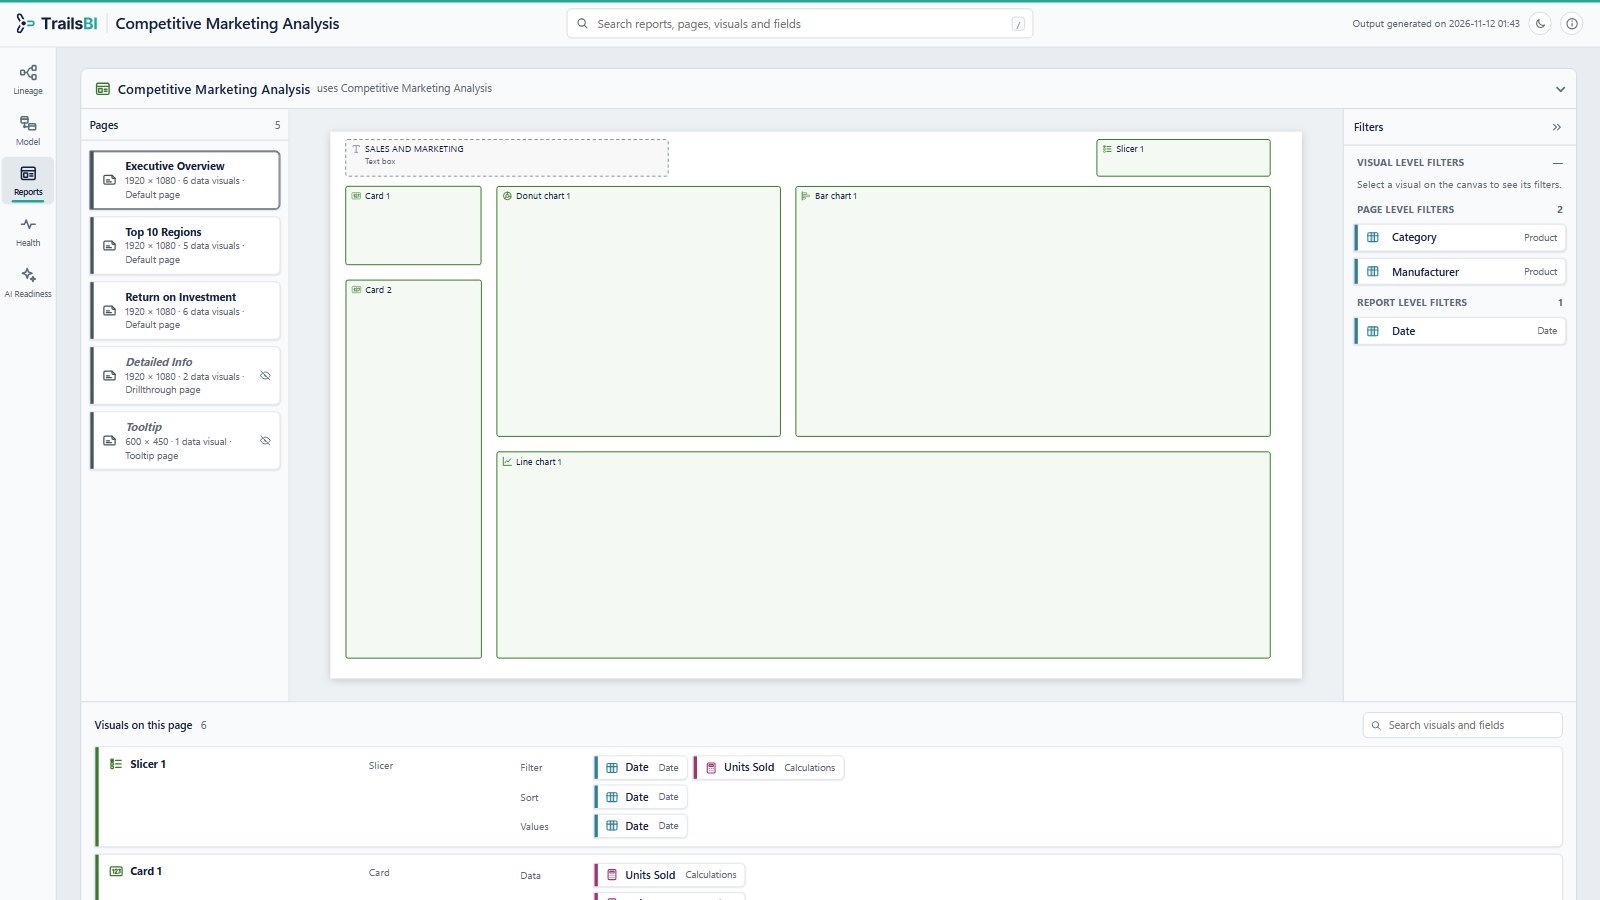
  3. Reports

    Every page drawn as a canvas, with the fields each visual uses and the filters at every level.

    TrailsBI Reports view showing the Executive Overview page of Microsoft's Competitive Marketing Analysis sampleTrailsBI Reports view showing the Executive Overview page of Microsoft's Competitive Marketing Analysis sample
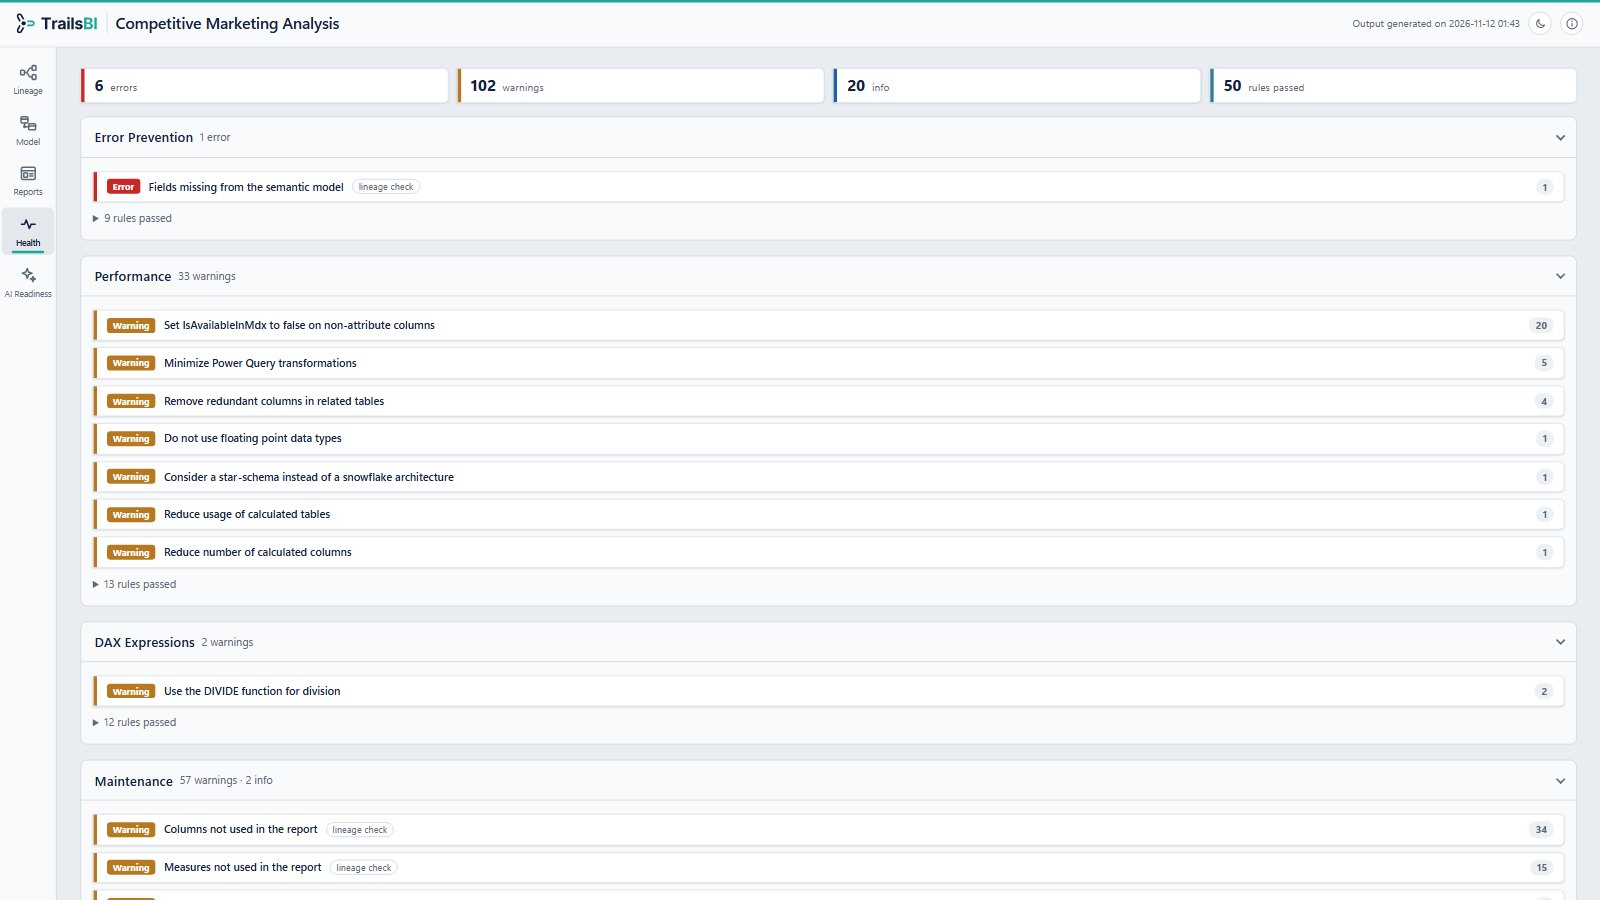
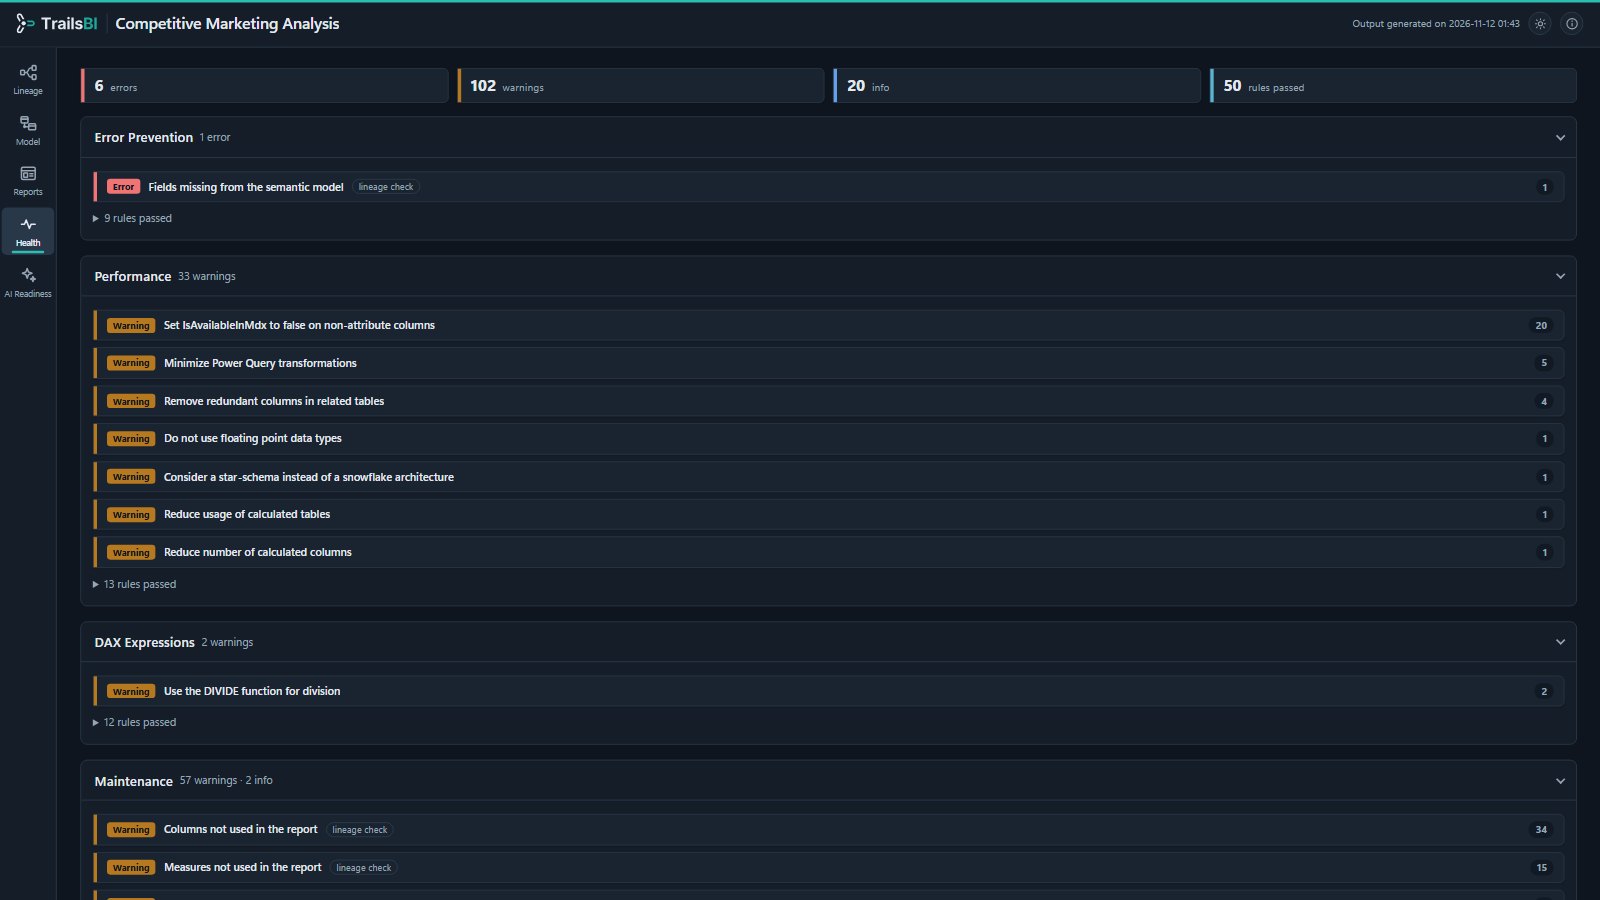
  4. Health

    Microsoft's Best Practice Analyzer rules, run straight from the project files, with lineage checks for missing and unused fields.

    TrailsBI Health view with errors, warnings and passed rules on Microsoft's Competitive Marketing Analysis sampleTrailsBI Health view with errors, warnings and passed rules on Microsoft's Competitive Marketing Analysis sample
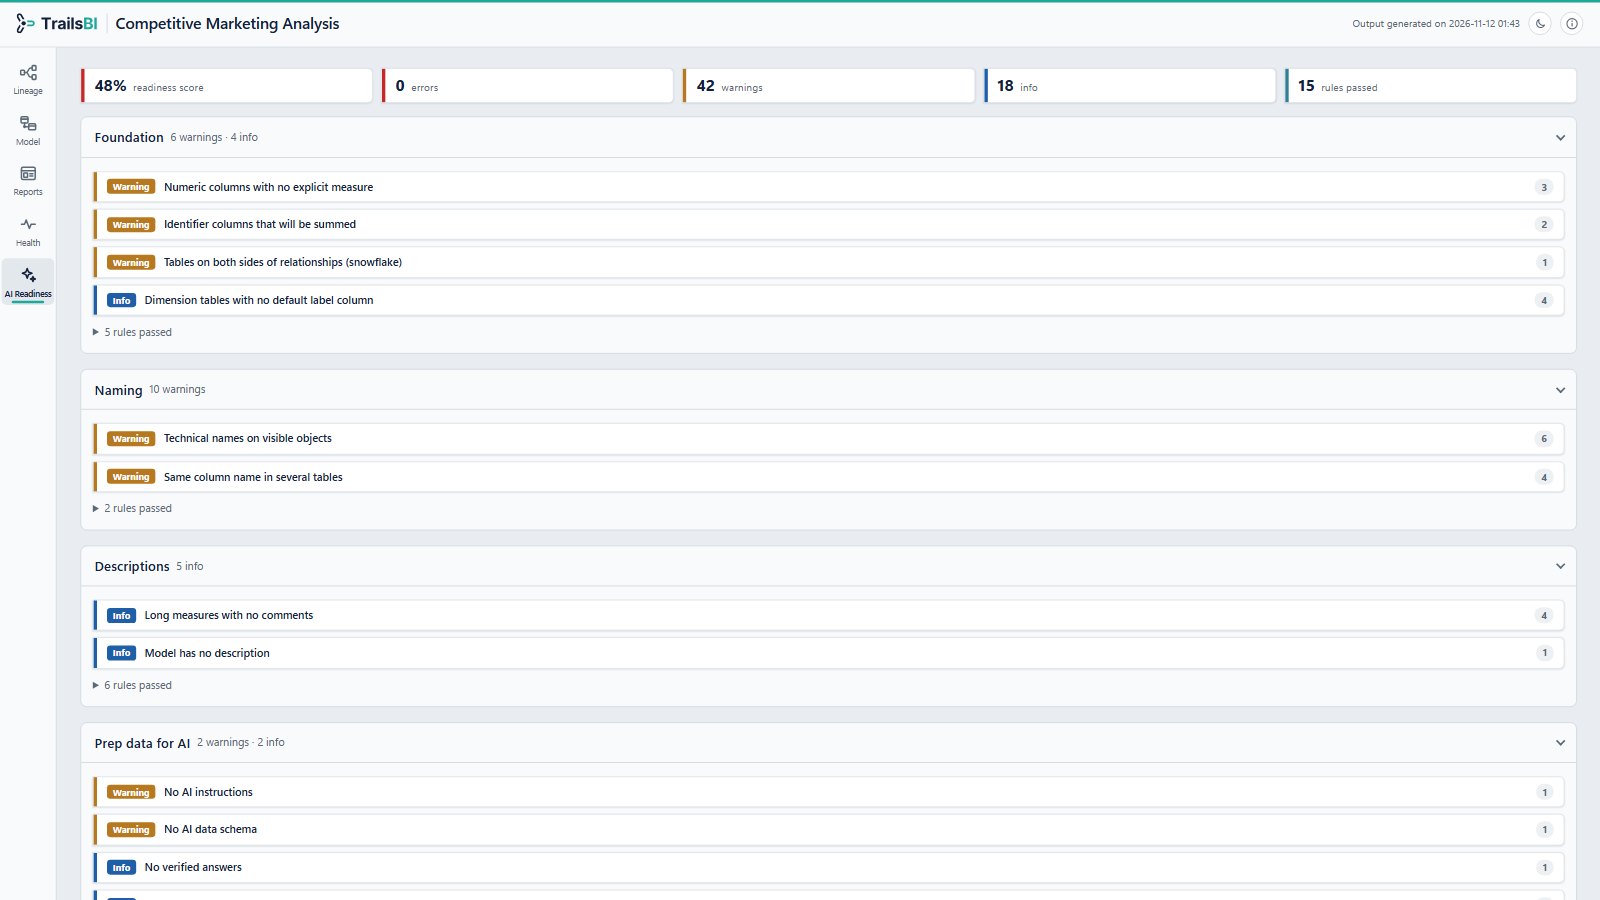
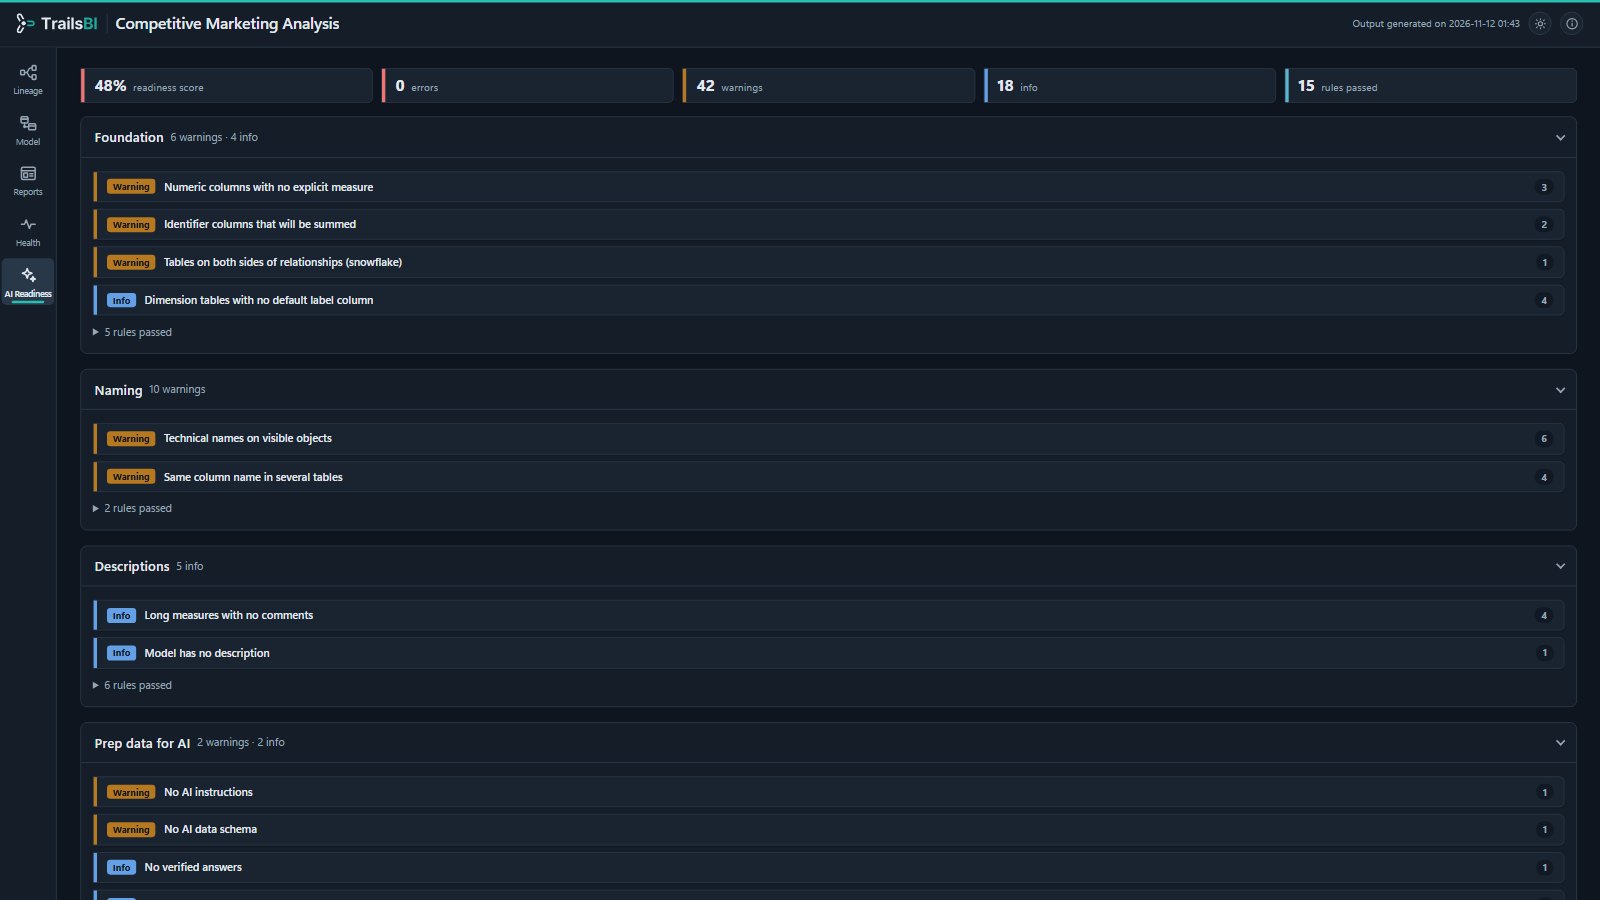
  5. AI Readiness

    A structural readiness score for Copilot, from the foundations Microsoft recommends to naming and AI instructions.

    TrailsBI AI Readiness view with a readiness score on Microsoft's Competitive Marketing Analysis sampleTrailsBI AI Readiness view with a readiness score on Microsoft's Competitive Marketing Analysis sample
TrailsBI Lineage view with compact cards, from the data sources to the visuals and pages, on Microsoft's Competitive Marketing Analysis sampleTrailsBI Lineage view with compact cards, from the data sources to the visuals and pages, on Microsoft's Competitive Marketing Analysis sample

Setup in 3, 2, 1...

You need Power BI Desktop and Python. Nothing else is installed, and nothing is uploaded.

  1. Step 1: Save as a Power BI project

    In Power BI Desktop: File, Save as, Power BI project (.pbip).

  2. Step 2: Install TrailsBI

    One package from PyPI, with no dependencies.

    pip install trailsbi
  3. Step 3: Run it on the project

    It writes one HTML file you can open in any browser or attach to a pull request.

    trailsbi "Sales.pbip"

Built to pass a security review

We understand that your Enterprise IP is yours to protect. You can trust TrailsBI. Trust

Runs offline
No network calls, no telemetry, no sign-in. The report opens with the network off.
Reads metadata, not data
It reads TMDL and PBIR files and never opens cache.abf or imported data.
No admin rights
Nothing to register, no tenant admin, no workspace permissions, no XMLA endpoint.
Open source
Apache-2.0, Python standard library only. Releases are built from public tags on GitHub.
Tested where you run it
Python 3.9 to 3.14 on Windows, plus Linux for CI pipelines.
Deterministic
Rule-based analysis, not AI. The same project gives the same findings every time.

Embed inside Power BI

The TrailsBI visual shows the same Lineage, Model, Reports, Health and AI Readiness views inside a Power BI report.

One command sets it up: --embed adds a hidden TrailsBI table to the model and a TrailsBI page with the visual already on it.

  1. Save your Power BI file in PBIP, then run:
    trailsbi "your-pbip-project-path" --embed
  2. Open the project and refresh (Home, Refresh), then go to the TrailsBI page.

Note: The TrailsBI page is hidden from report readers, but the table holds your model's names, DAX and data source addresses. Embed it only where that is allowed.

Report not in the PBIR format? Add the visual by hand.