Which columns and measures can I safely remove?
How to find the columns, measures and tables that nothing in your reports depends on, across every report built on a semantic model, so you can clean up the model without breaking a visual.
Why it's hard to tell in Power BI
Power BI Desktop can tell you which fields one report uses, but a shared semantic model usually has many reports, often built by different people in different workspaces. Nothing built in lists the columns and measures that none of them use, so cleanup turns into opening every report, or guessing.
“I'm sure 60%+ of the fields in my models aren't being used, but some of these reports are huge and several years old, so I'd have to do a deep discovery to find that out on my own.”
r/PowerBI, 2023. Read the thread
A Microsoft idea asking for a way to find the tables and columns nothing uses had 211 votes in November 2026.1 A related forum question asks the same thing for the reports on one model, so its author would not have to open each report in turn.2
How to find them with TrailsBI
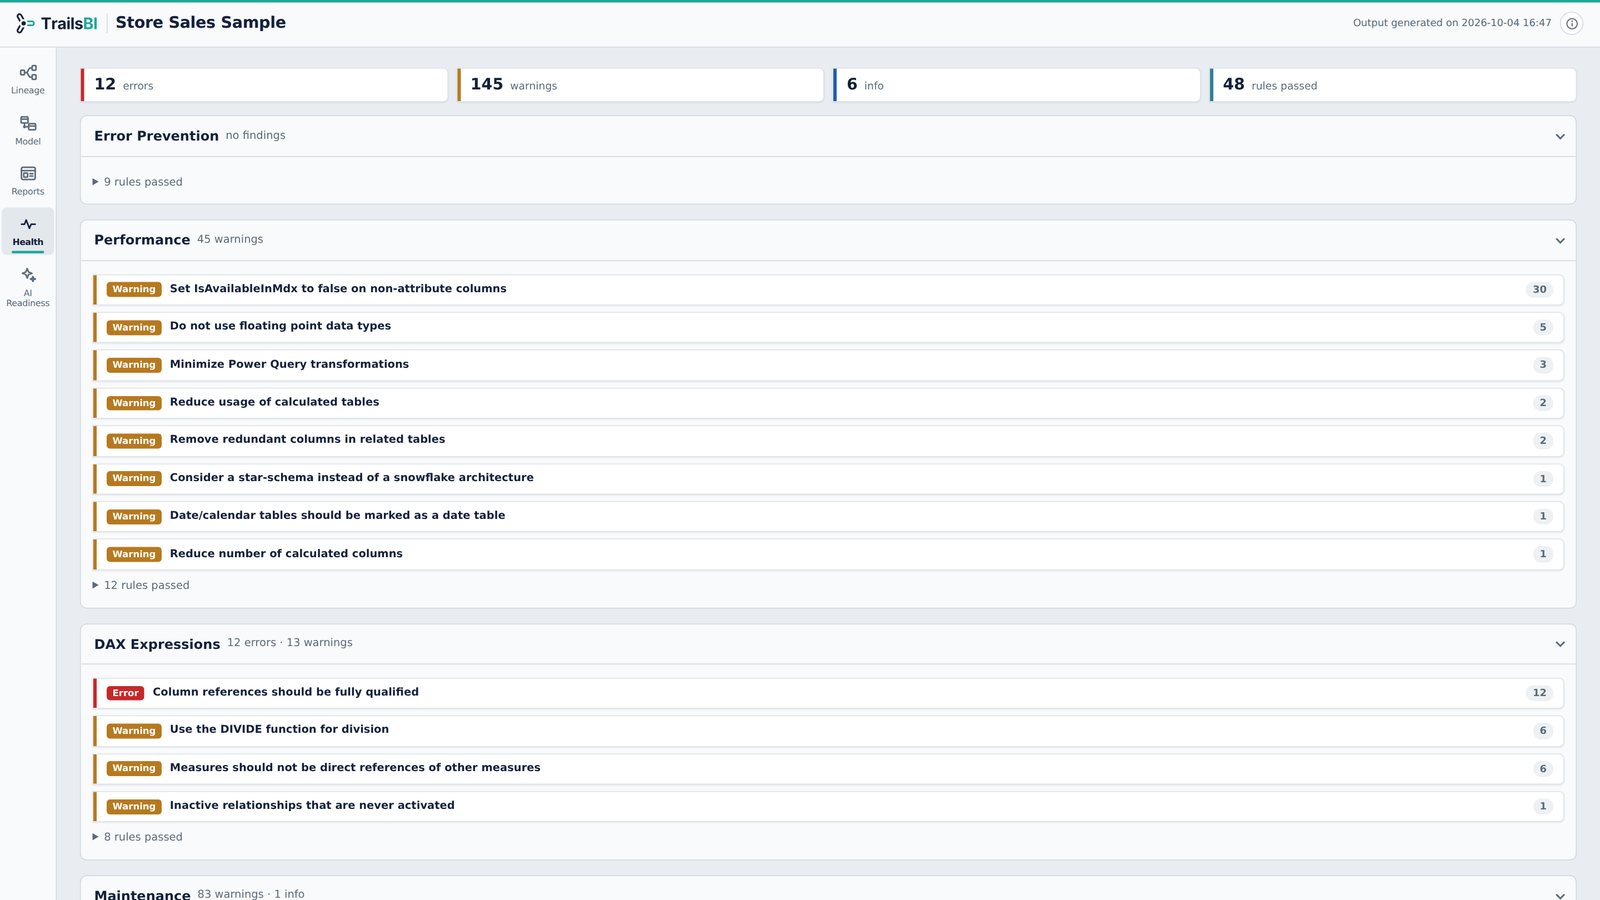
TrailsBI reads the model and every report you give it, then marks every column, measure and table that a visual, a filter, or a measure used by one of those depends on. What's left is listed in the Health view under Maintenance: columns, measures, tables and calculation groups not referenced in the reports you gave it.
- Put the semantic model and the reports that use it in one folder, or point TrailsBI at several workspace folders.
- Run TrailsBI on the folder:
trailsbi "D:\Git\Sales workspace" --model "Sales" --with-reports - Open the Health view. Each finding lists the fields it is about; select one to see it in the Lineage view and confirm nothing depends on it.
Calculated columns are marked, so you can see which ones cost refresh time, and relationship keys carry a note so you don't remove a key a relationship still needs.
What it doesn't see
- Reports that aren't saved as Power BI projects in the folders you give it. A field used only by a report TrailsBI can't see will look unreferenced.
- Excel workbooks, paginated reports, Analyze in Excel and anything else that queries the model directly.
- Usage: it tells you what references a field, not whether anyone looks at it.
- It lists what to remove. It doesn't change your model.
Questions
Does removing these columns improve report performance?
Not necessarily. The engine stores columns compressed and only reads the ones a query asks for, so removing a column nobody uses mostly shrinks the model and makes it easier to understand. Practitioners have reported large size cuts with no change in refresh time. The safer reason to clean up is clarity, a smaller model and fewer surprises.
What about columns used only in relationships?
TrailsBI lists relationship keys with a note, because nothing on a page uses them directly. Keep them if the relationship filters a table your reports use.
A measure is only used by another measure. Is it listed?
No. TrailsBI follows DAX dependencies to the visuals, so a measure that feeds a used measure counts as used.
What about report-level measures in thin reports?
They are tracked too. A report measure no visual uses is listed, and the Health view also suggests moving report measures into the model so other reports can use them.