The TrailsBI visual
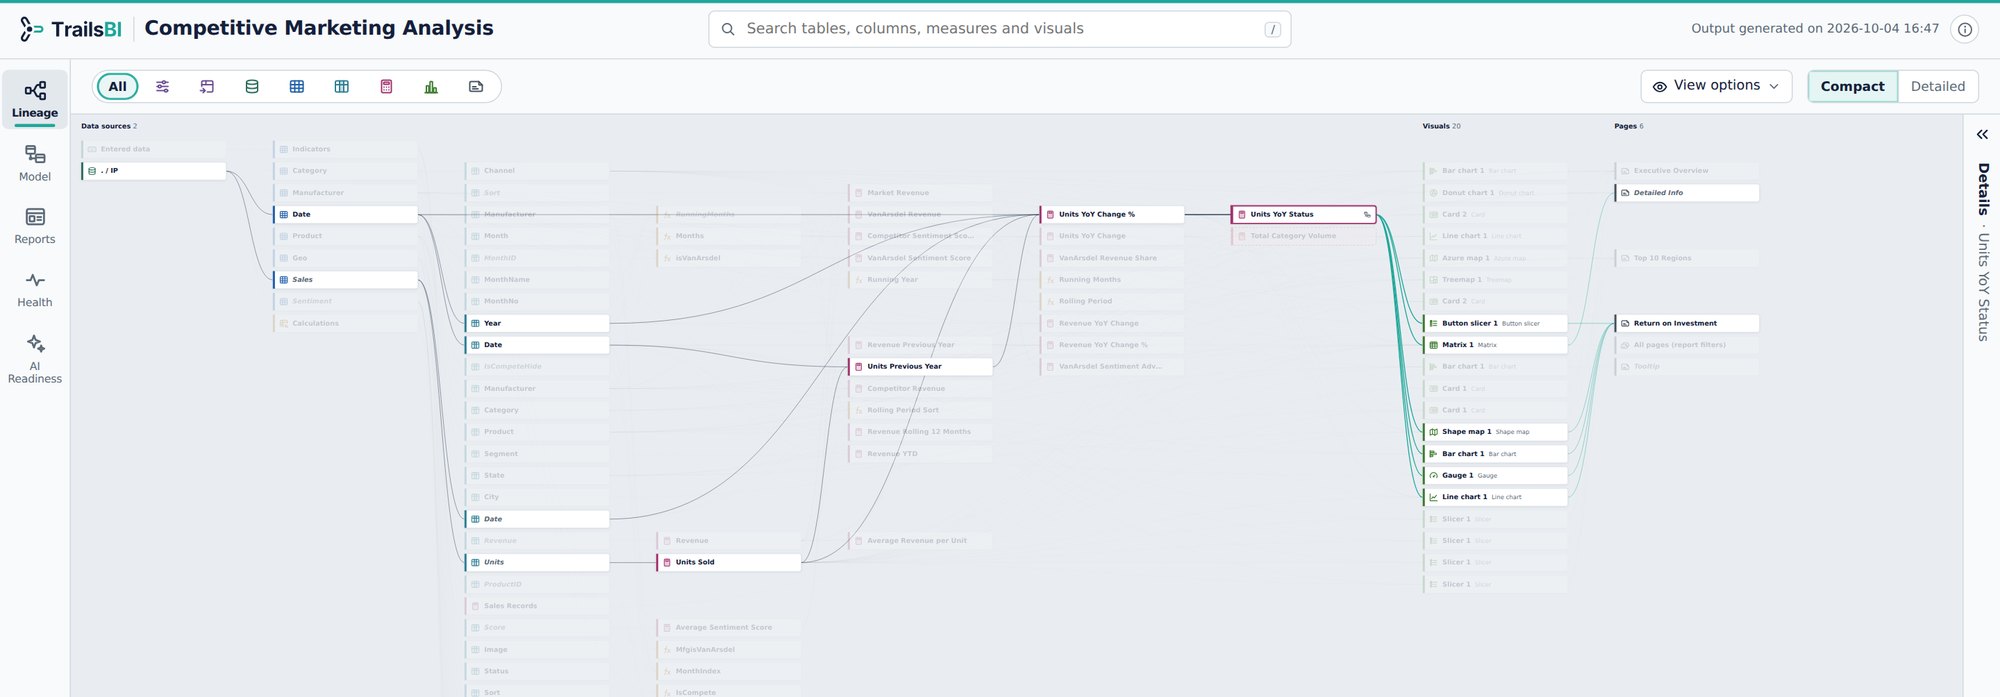
The same views as the HTML page, inside a Power BI report. One command adds a hidden TrailsBI table to the model and a TrailsBI page with the visual already on it.
Set it up
- Close the project in Power BI Desktop, then run:
trailsbi "D:\Reports\Sales" --embed - Open the project and refresh (Home, Refresh) so the new table loads.
- Go to the TrailsBI page. It is hidden from report readers in view mode, and the visual on it is already set up.
Run --embed again whenever the model or report changes, then refresh. It replaces the table, keeps the TrailsBI page as you left it, and brings the visual up to date. TrailsBI leaves its own table, page and visual out of the analysis.
Get the visual
The page needs a report saved in the PBIR format, the default for Power BI projects since 2025. For an older report, download TrailsBI.pbiviz from the latest release, import it from the Visualizations pane, add it to a page, and drag the hidden TrailsBI Chunk column onto it.
Get the TrailsBI visual on Microsoft Marketplace
Before you embed
The TrailsBI table holds the model's names, DAX and data source addresses, so anyone who can open the report can read them in the visual. Embed it only where that is allowed. In the Power BI service, a visual that isn't from AppSource needs the tenant setting that allows visuals created with the Power BI SDK, unless your admin adds it as an organizational visual.
Answers these questions
See it on a real model: Competitive Marketing Analysis. Open the Lineage view from the side rail.