Reports
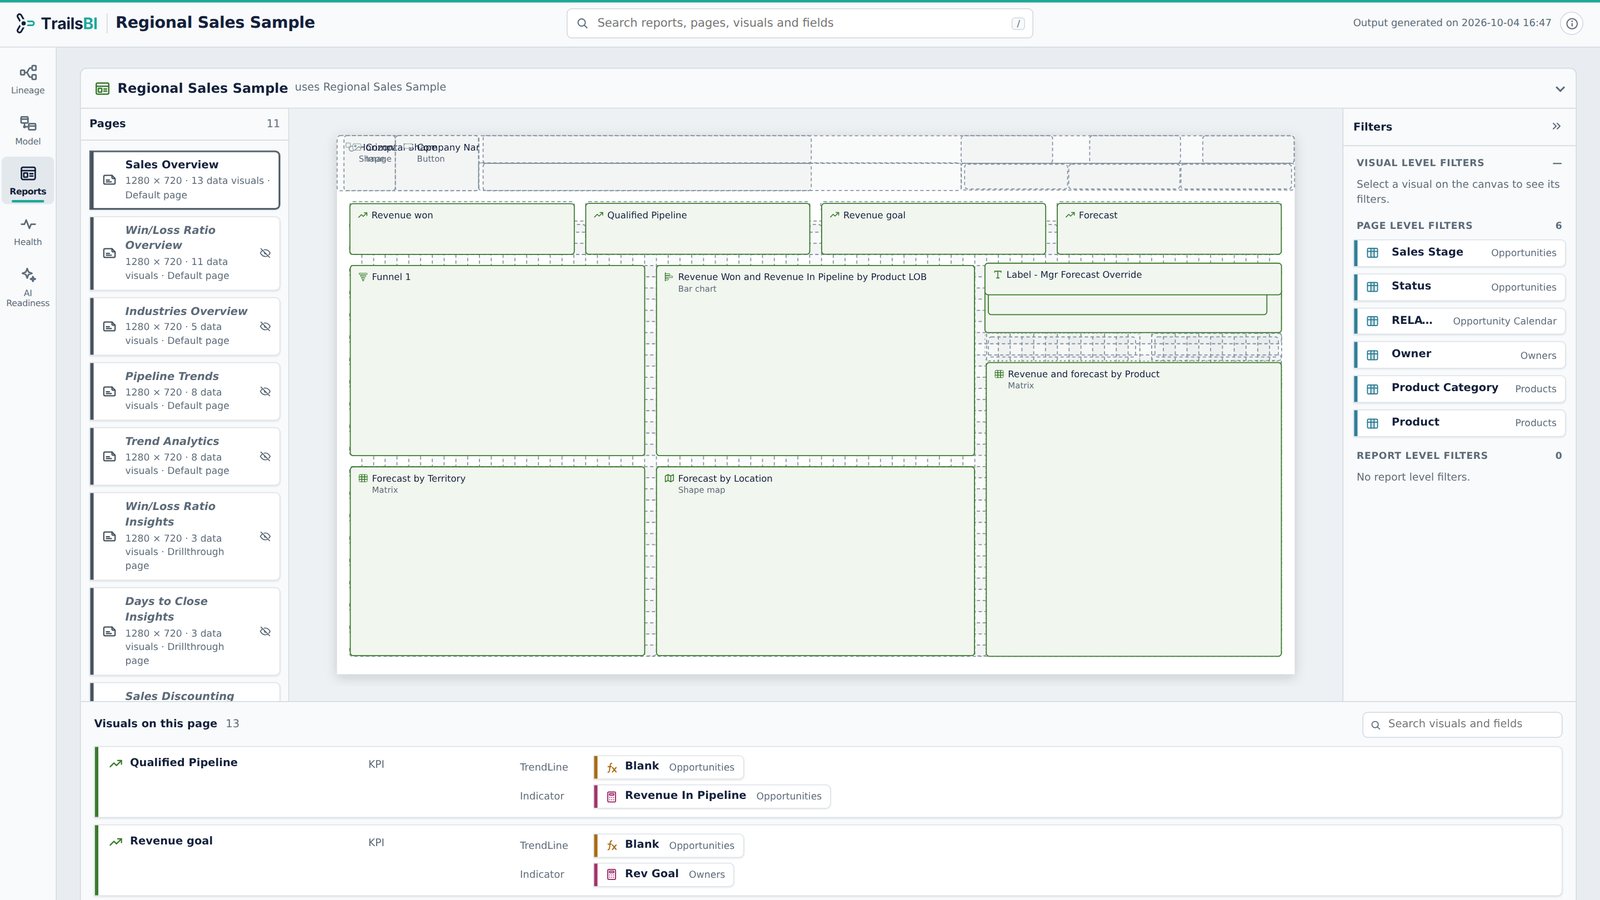
Every page drawn as a canvas preview, with the fields each visual uses, the filters at every level, and the fields the model no longer has.
What it shows
- Each page as a canvas preview, with page, report and visual-level filters.
- Each visual's fields by role: values, axis, legend, sort, filters and formatting.
- Measures defined in the report itself (thin reports), shown apart from the model's measures.
Missing fields
Fields a visual or filter uses but the model no longer has are flagged on the visual and listed in the Health view, so you find them before your users see "Something's wrong with one or more fields".
Answers these questions
See it on a real model: Regional Sales. Open the Reports view from the side rail.