Model
A searchable list of the whole semantic model, with the DAX and Power Query one click away, and a relationship diagram laid out for you.
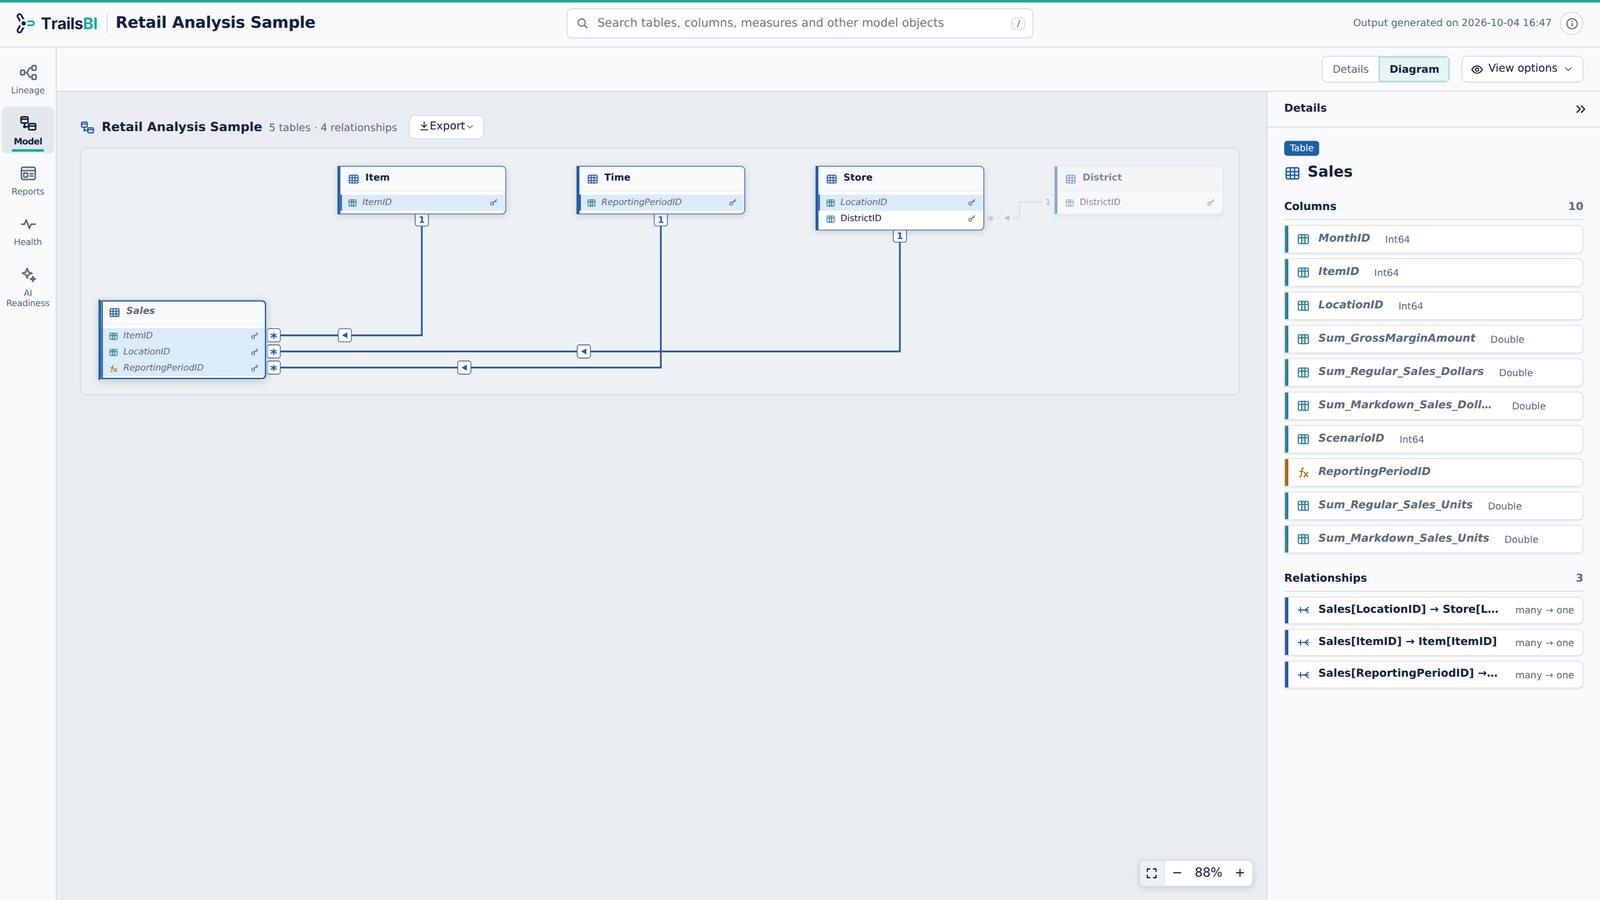
What it shows
- Every table, column, measure, calculation group, hierarchy, partition, parameter and relationship in the model.
- The DAX or Power Query (M) of each item, with function help when you point at a function.
- Calculated columns and tables marked apart from data columns.
Relationship diagram
The diagram is laid out for you, with cardinality and filter direction on every line. Export it as PNG or SVG, with table and column names hidden when you want to share the shape of a model without its names.
Answers these questions
See it on a real model: Retail Analysis. Open the Model view from the side rail.