Lineage
Pick any column or measure and see everything it depends on, back to the data source, and everything built on it, down to the visuals and pages.
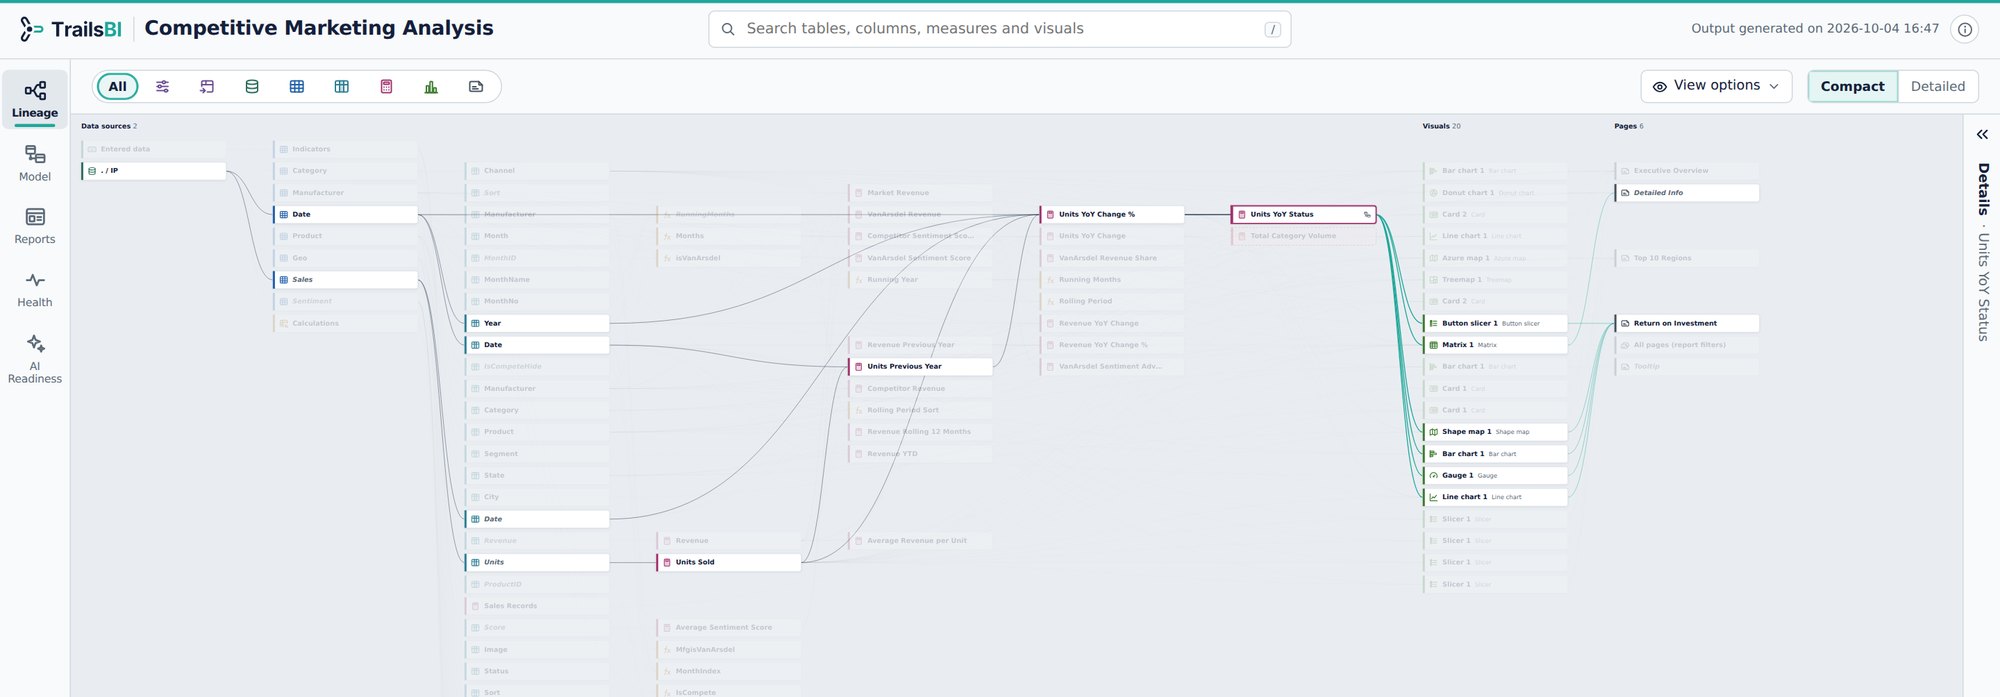
What it shows
- Data sources, Power Query queries, tables, columns and measures, through to visuals and pages.
- Select any card: what it depends on is highlighted on one side, everything built on it on the other.
- Compact cards for the whole picture, detailed cards with usage counts when you need them.
- Measures added in live-connected reports are tracked and shown apart from the model's own.
- Point at any DAX or Power Query function in the code for its syntax, a short description and a link to Microsoft Learn.
Map and Graph
The Map shows the lineage in columns, from sources on the left to pages on the right. Graph shows the same items and links as one network, with the sources in the middle and pages and visuals on the outside. Both use the same filters, search and selection, so an item selected in one stays selected in the other.
Filters and search
Type filters hide whole kinds of item: parameters, queries, sources, tables, columns, measures, visuals and pages. Search finds any name across the whole project.
Answers these questions
See it on a real model: Competitive Marketing Analysis. Open the Lineage view from the side rail.