Microsoft sample · a retail chain
Store Sales
The same retail data as Retail Analysis, modelled differently: store and district sales, this year against last year.
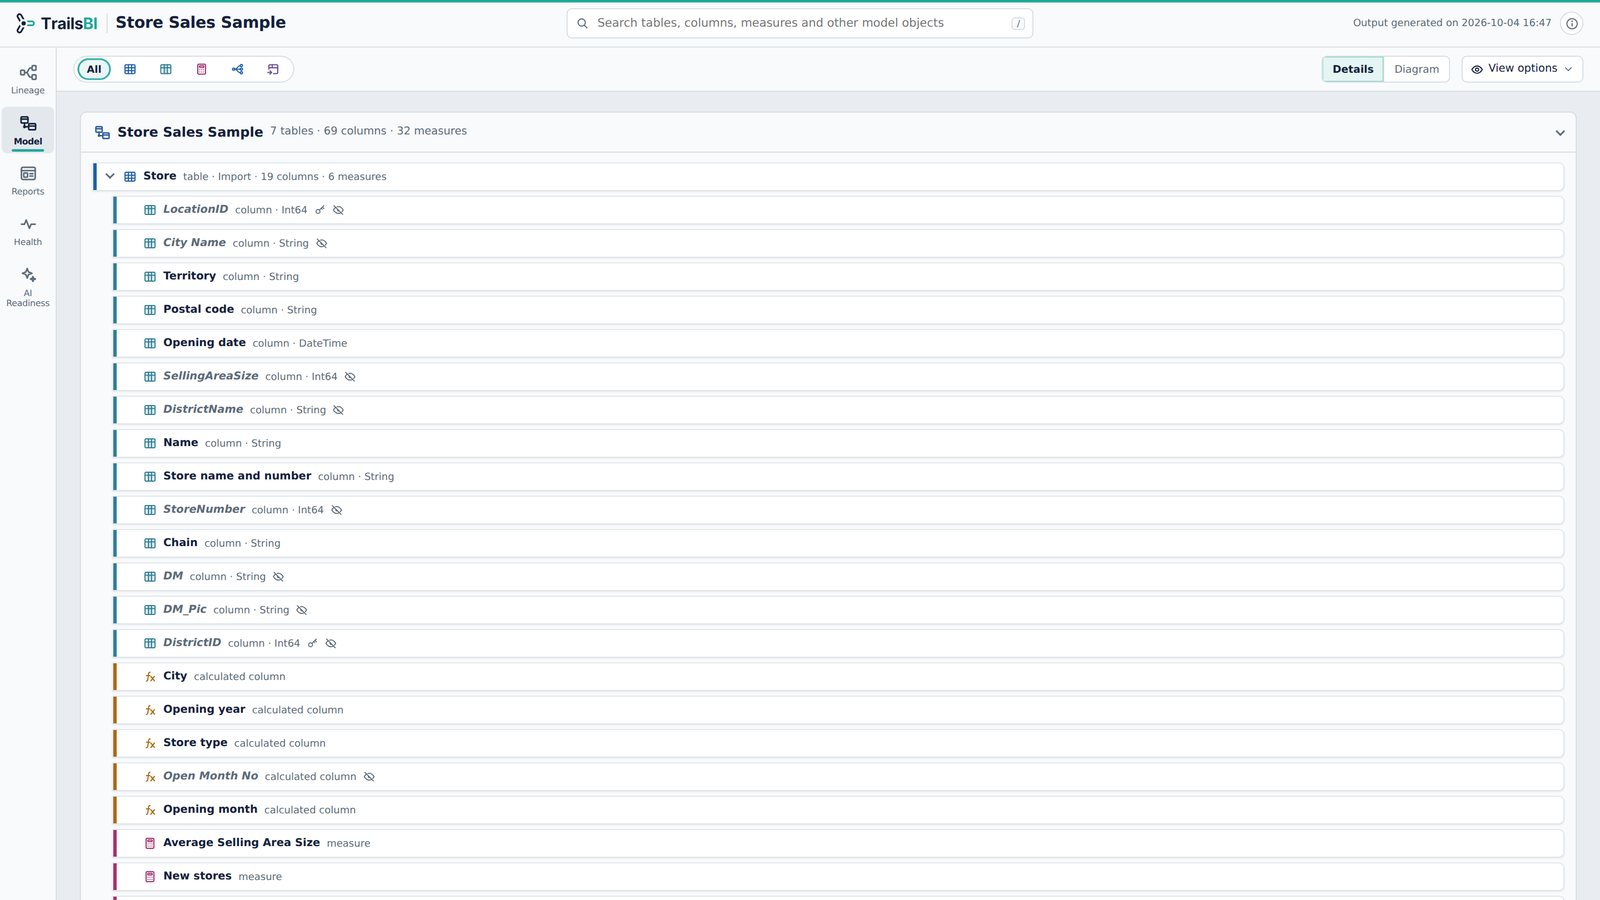
- tables
- 7
- columns
- 69
- measures
- 32
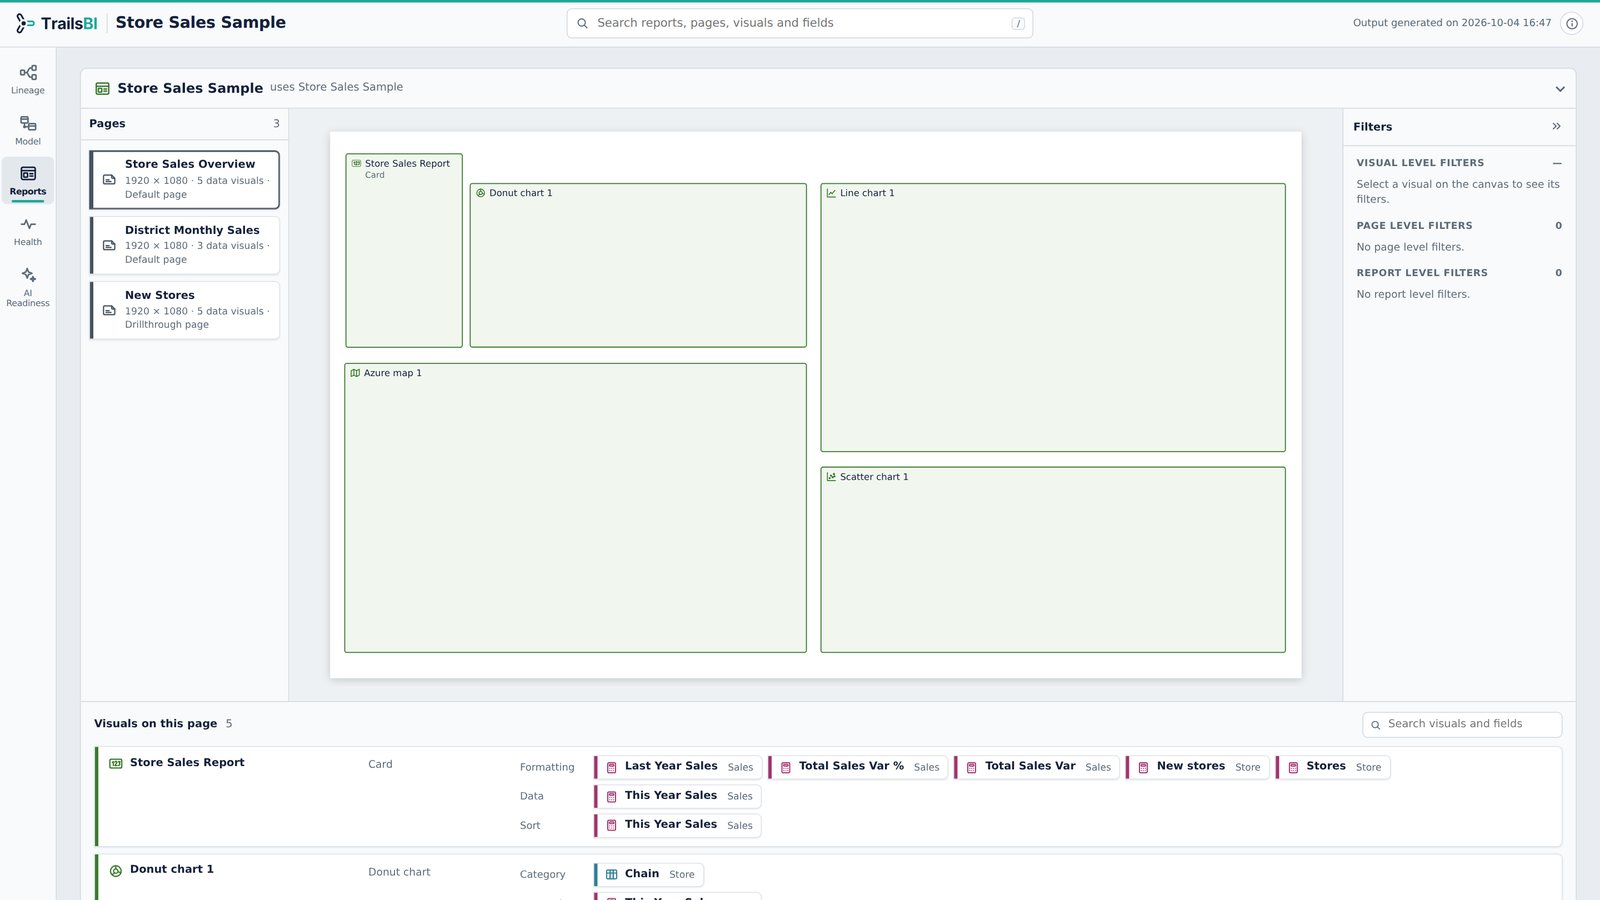
- pages
- 3
- visuals
- 13
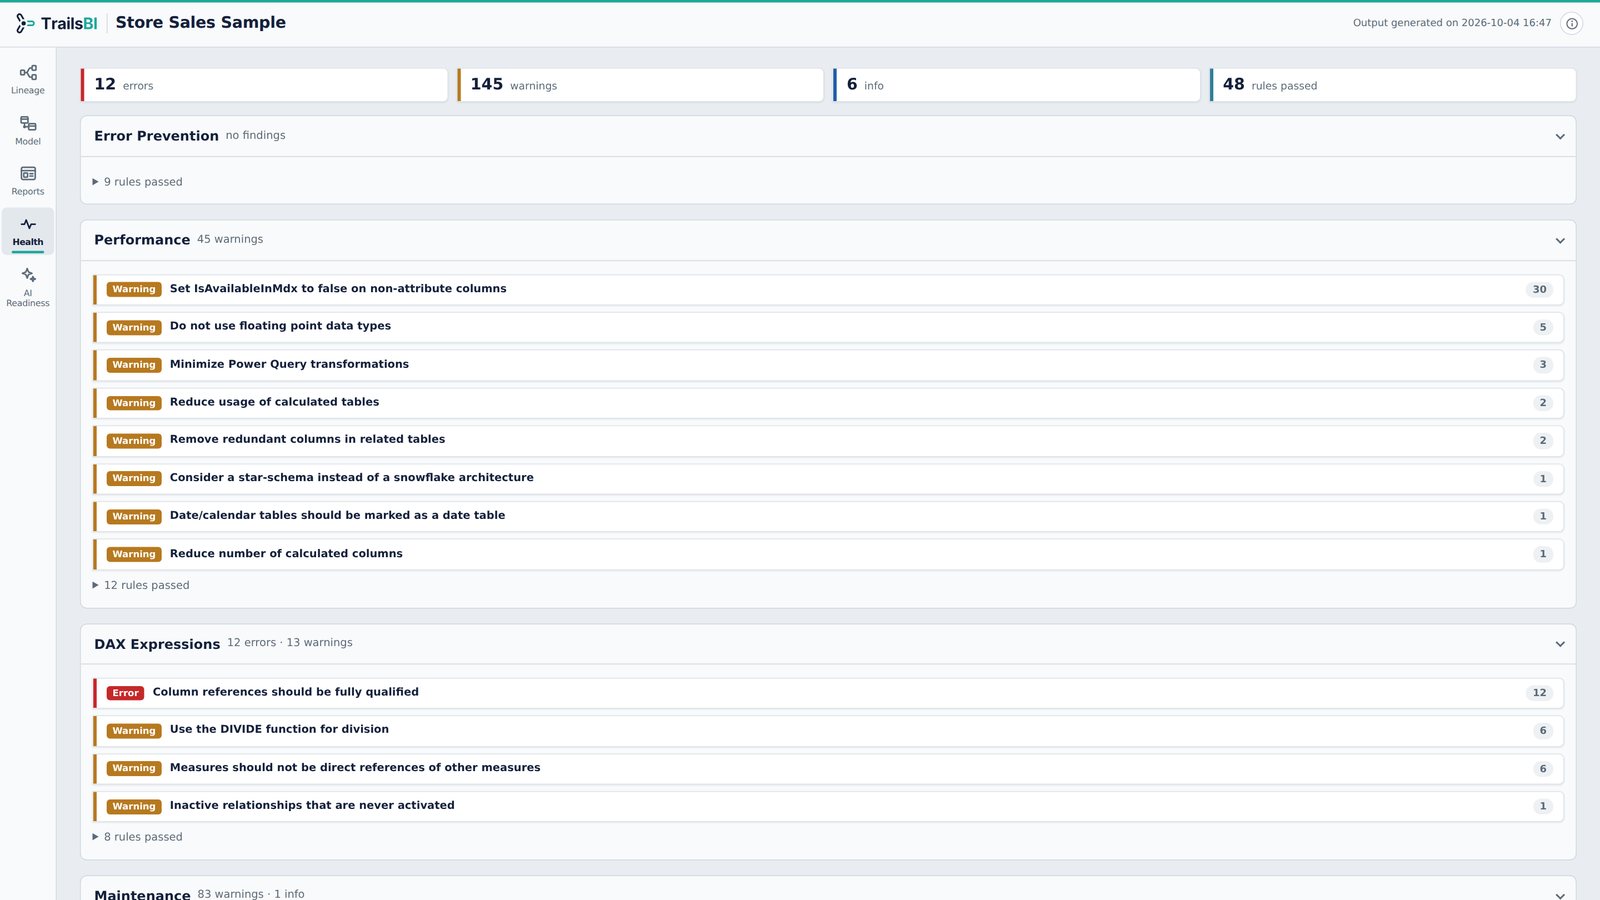
- BPA findings
- 159
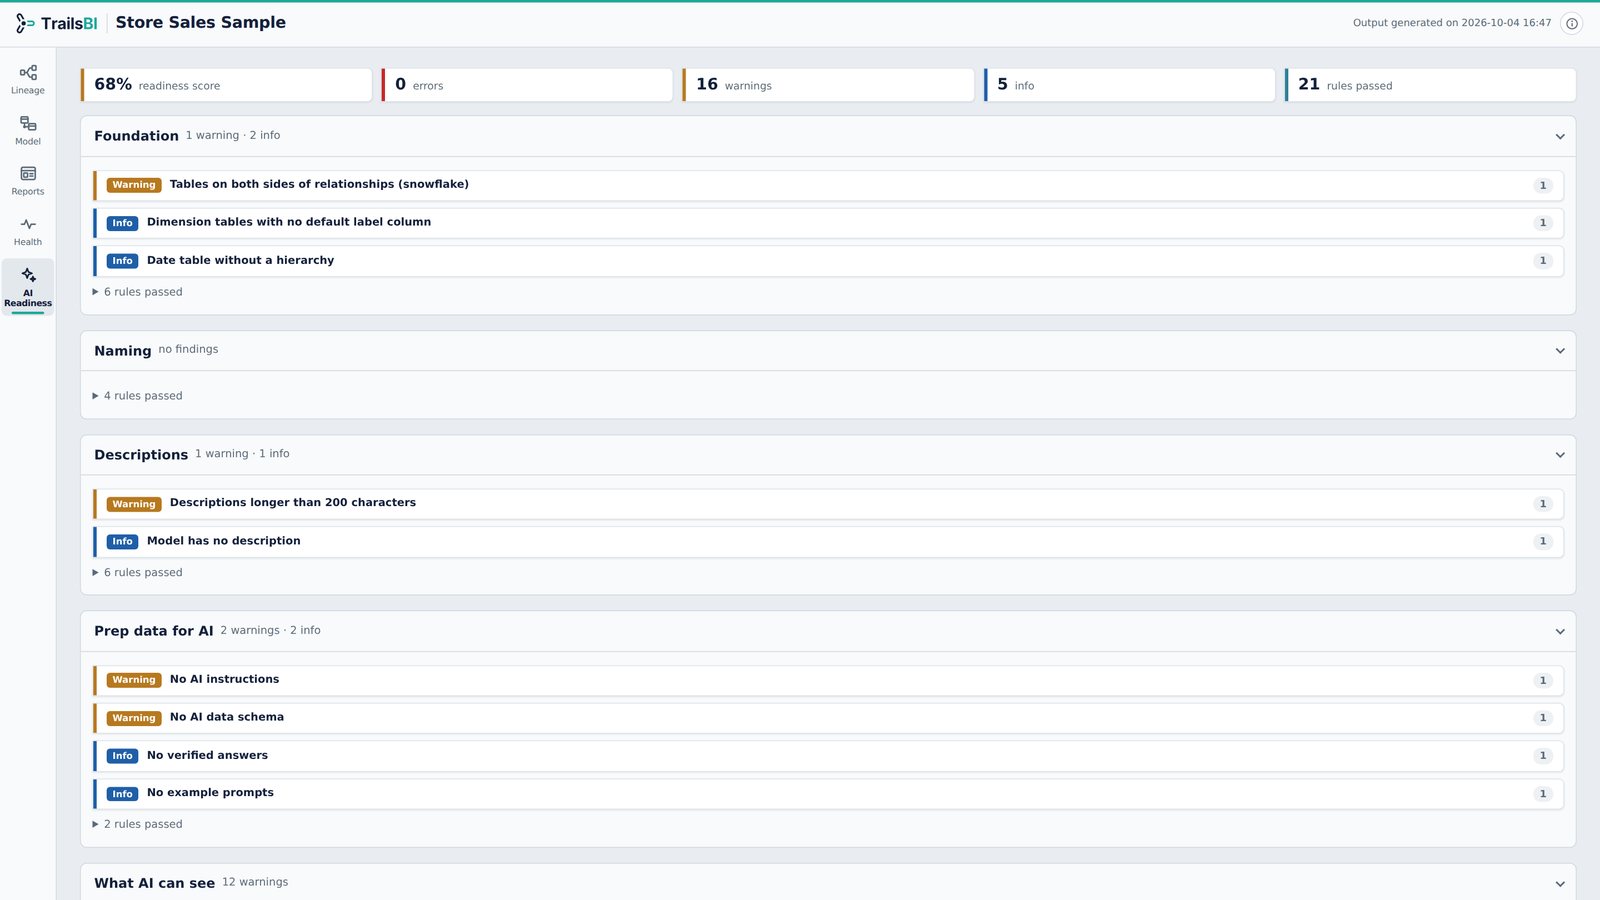
- AI Readiness Score
- 68%
trailsbi "D:\Reports\Store Sales Sample"What TrailsBI found
- Unused
ClusterMappingTable 2is a calculated table that nothing on any page uses. Along with it, 18 measures and 45 columns are unused. - Warning
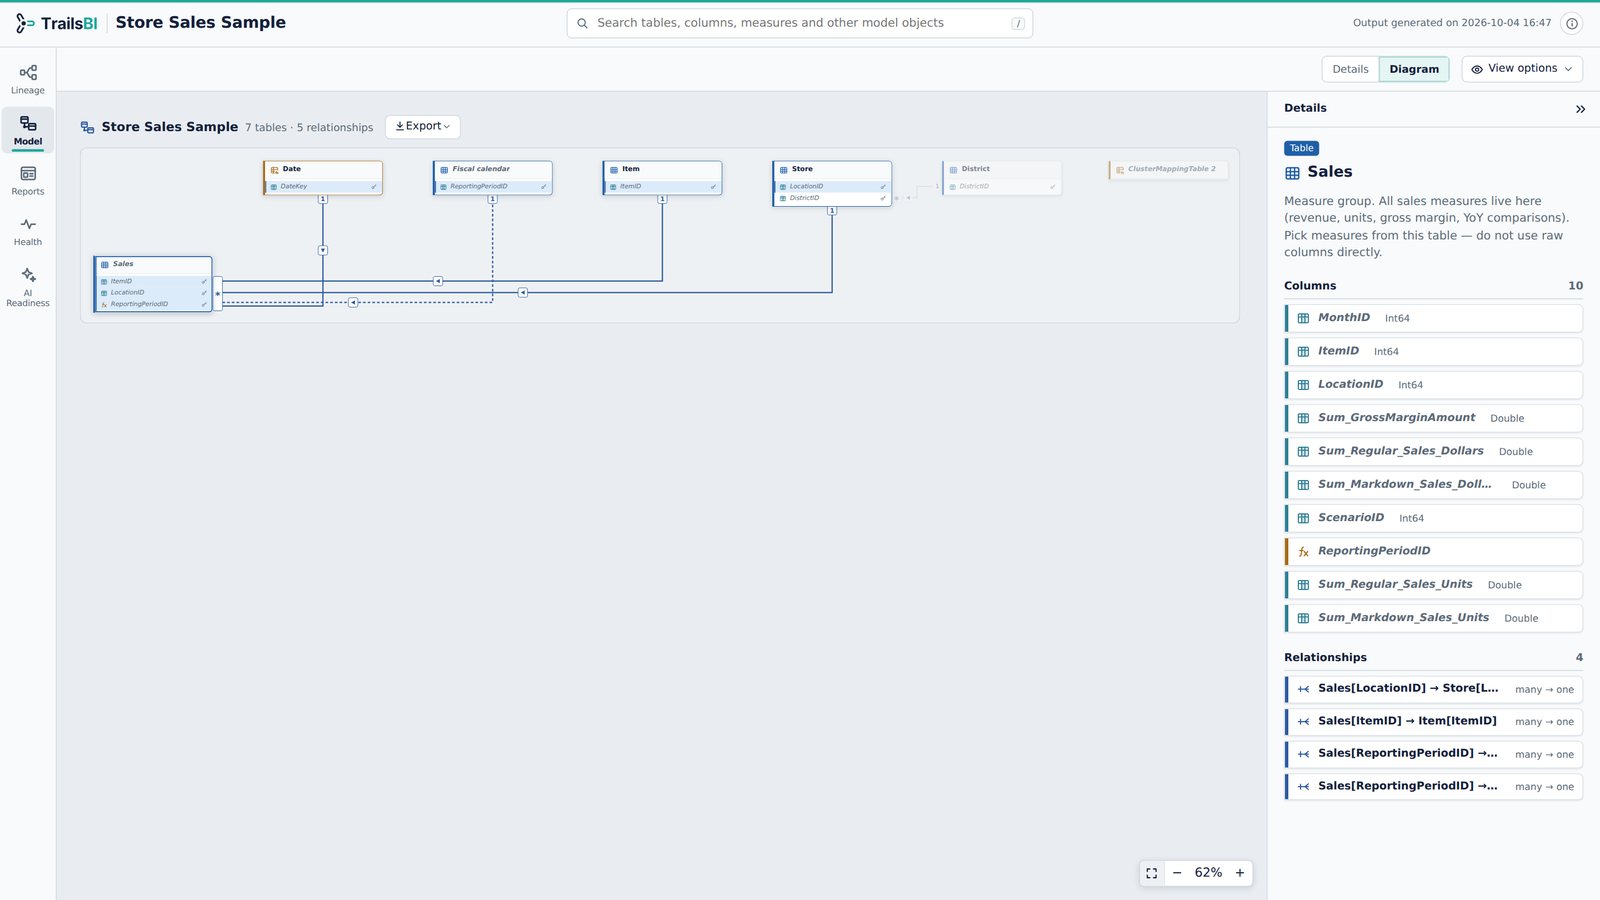
Sales[ReportingPeriodID] → Fiscal calendaris inactive and no measure activates it with USERELATIONSHIP. - Warning
The Date table is calculated but not marked as a date table, which affects time-intelligence functions.
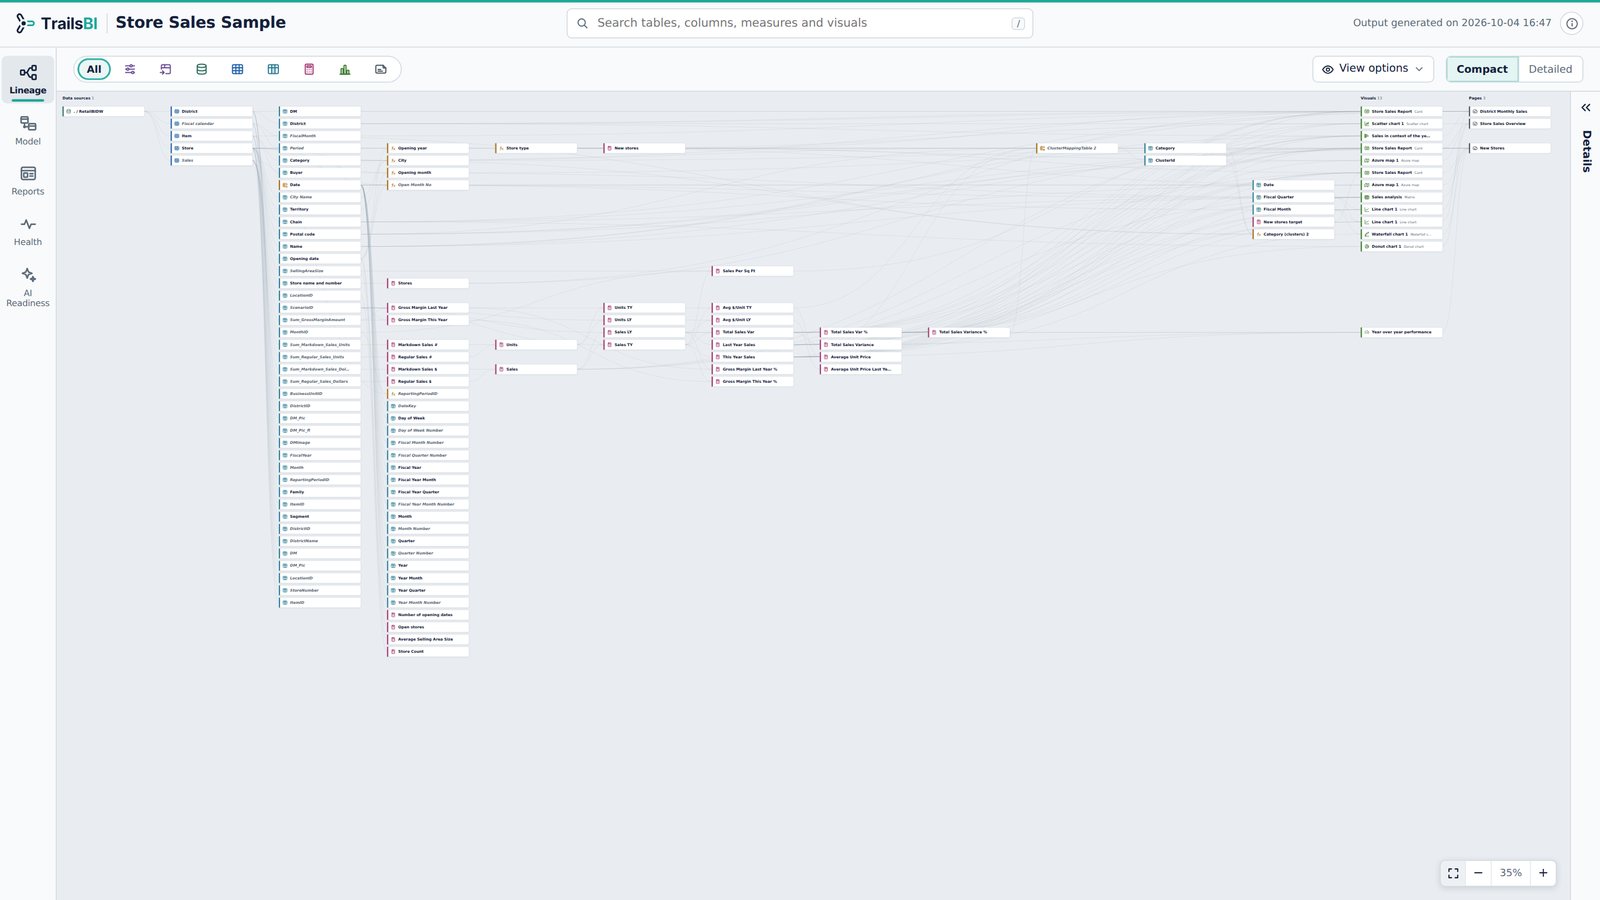
Every view, on this model
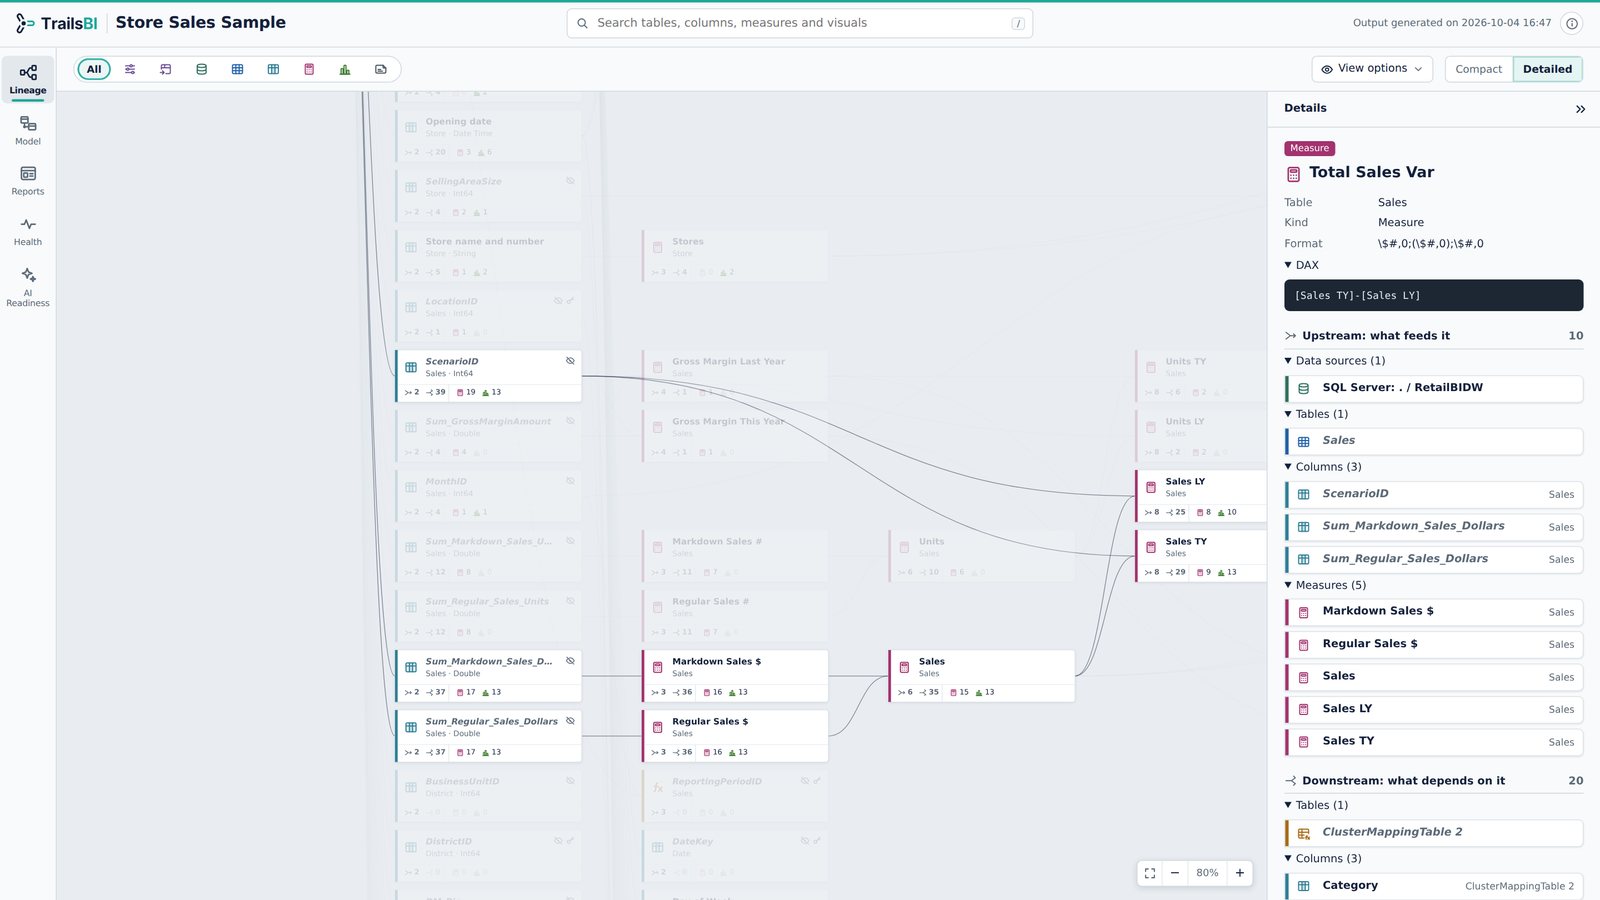
[Sales TY]-[Sales LY], with 10 items feeding it and 20 depending on it. The Details panel lists everything upstream and downstream.