Microsoft sample · Contoso

Regional Sales

A sales manager's view of which products and regions drive revenue, built on Dynamics 365 Sales data.

tables
10
columns
73
measures
15
pages
11
visuals
58
BPA findings
189
AI Readiness Score
41%
trailsbi "D:\Reports\Regional Sales Sample"

What TrailsBI found

  • Error

    A Key Influencers visual explains by Accounts[Industry], [Territory] and [Region]. None of those columns exist.

  • Error

    A page filter uses Opportunities[Opportunity Owner Name], which is also missing from the model.

  • Impact

    Revenue Won feeds 36 items: measures, visuals across 11 pages and the filters that use it.

Every view, on this model
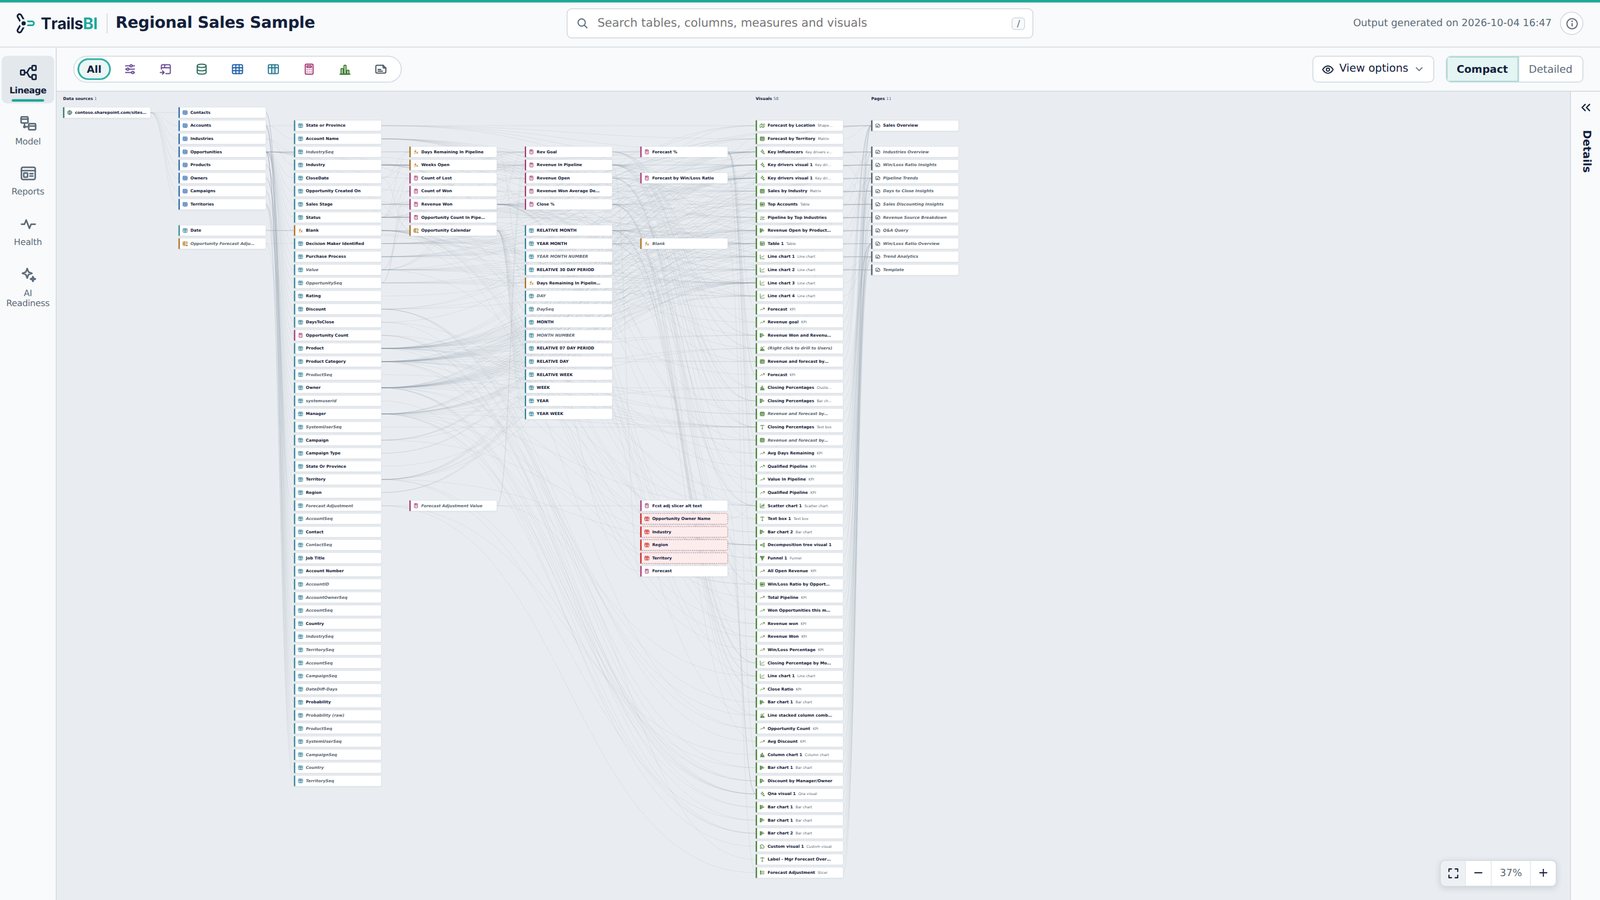
Regional Sales in TrailsBI: Lineage · Compact View
Lineage · Compact View. The whole model on one screen. All items in one picture, from data sources through tables, columns and measures to the visuals and pages that use them.
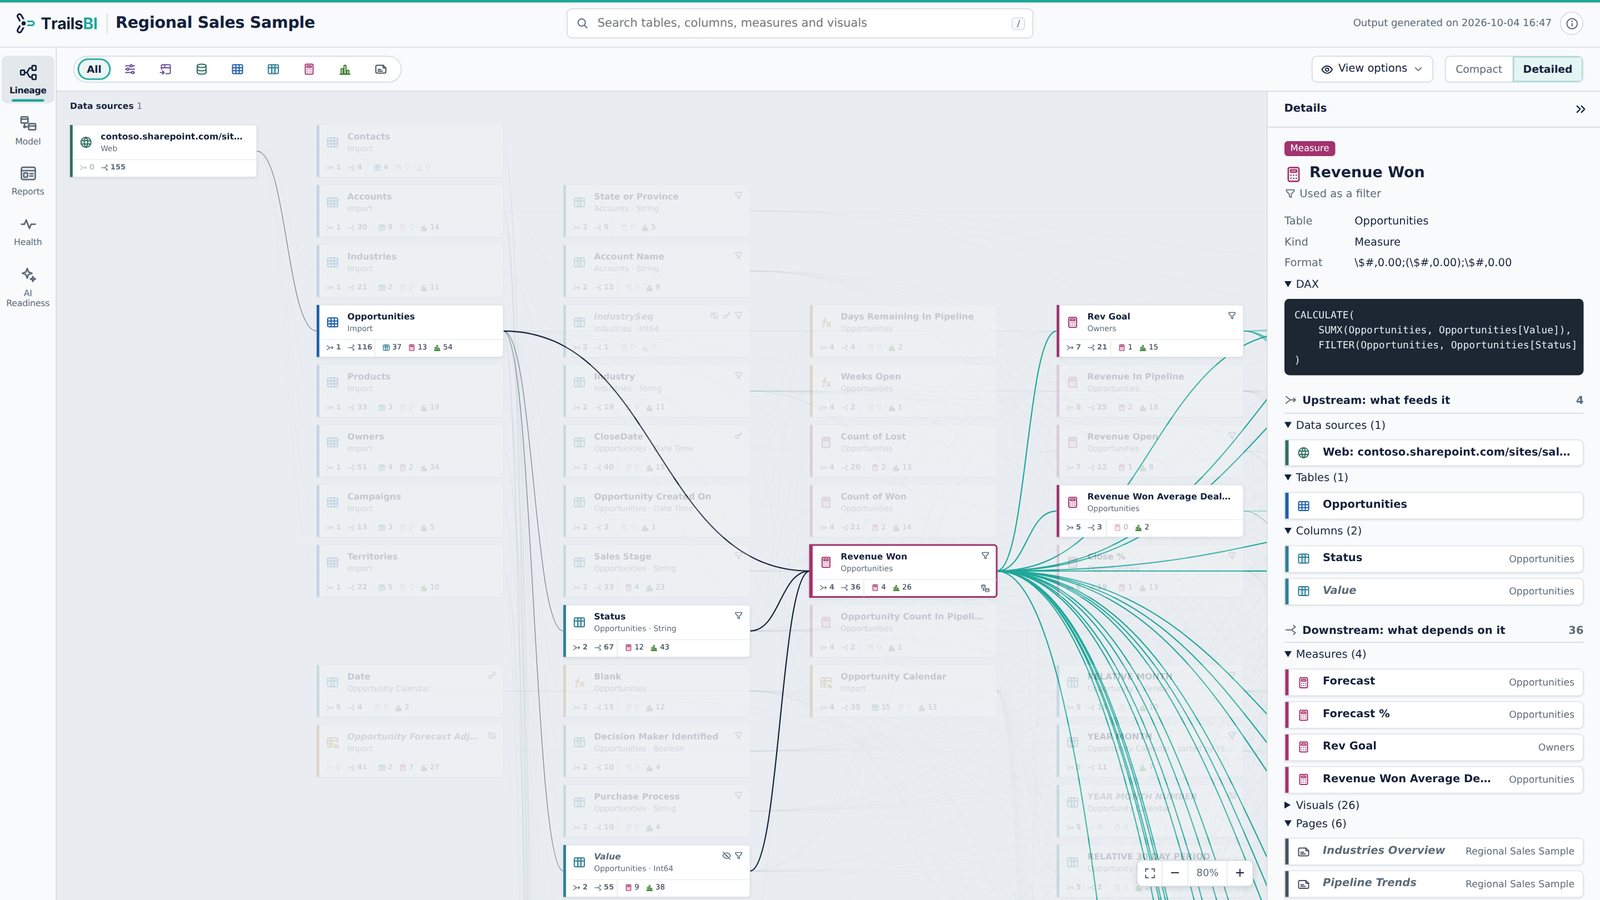
Regional Sales in TrailsBI: Lineage · Detailed View
Lineage · Detailed View. Trace any item from source to visual. Revenue Won selected: one Excel workbook feeds it through Status and Value; 36 items depend on it. The Details panel lists everything upstream and downstream.
Regional Sales in TrailsBI: Lineage · Graph View
Lineage · Graph View. The whole project in rings. Data sources in the middle, tables with their columns and measures around them, pages and their visuals on the outer ring. Revenue Won selected: it reaches 26 visuals on 6 pages, in teal, and what it depends on shows in navy.
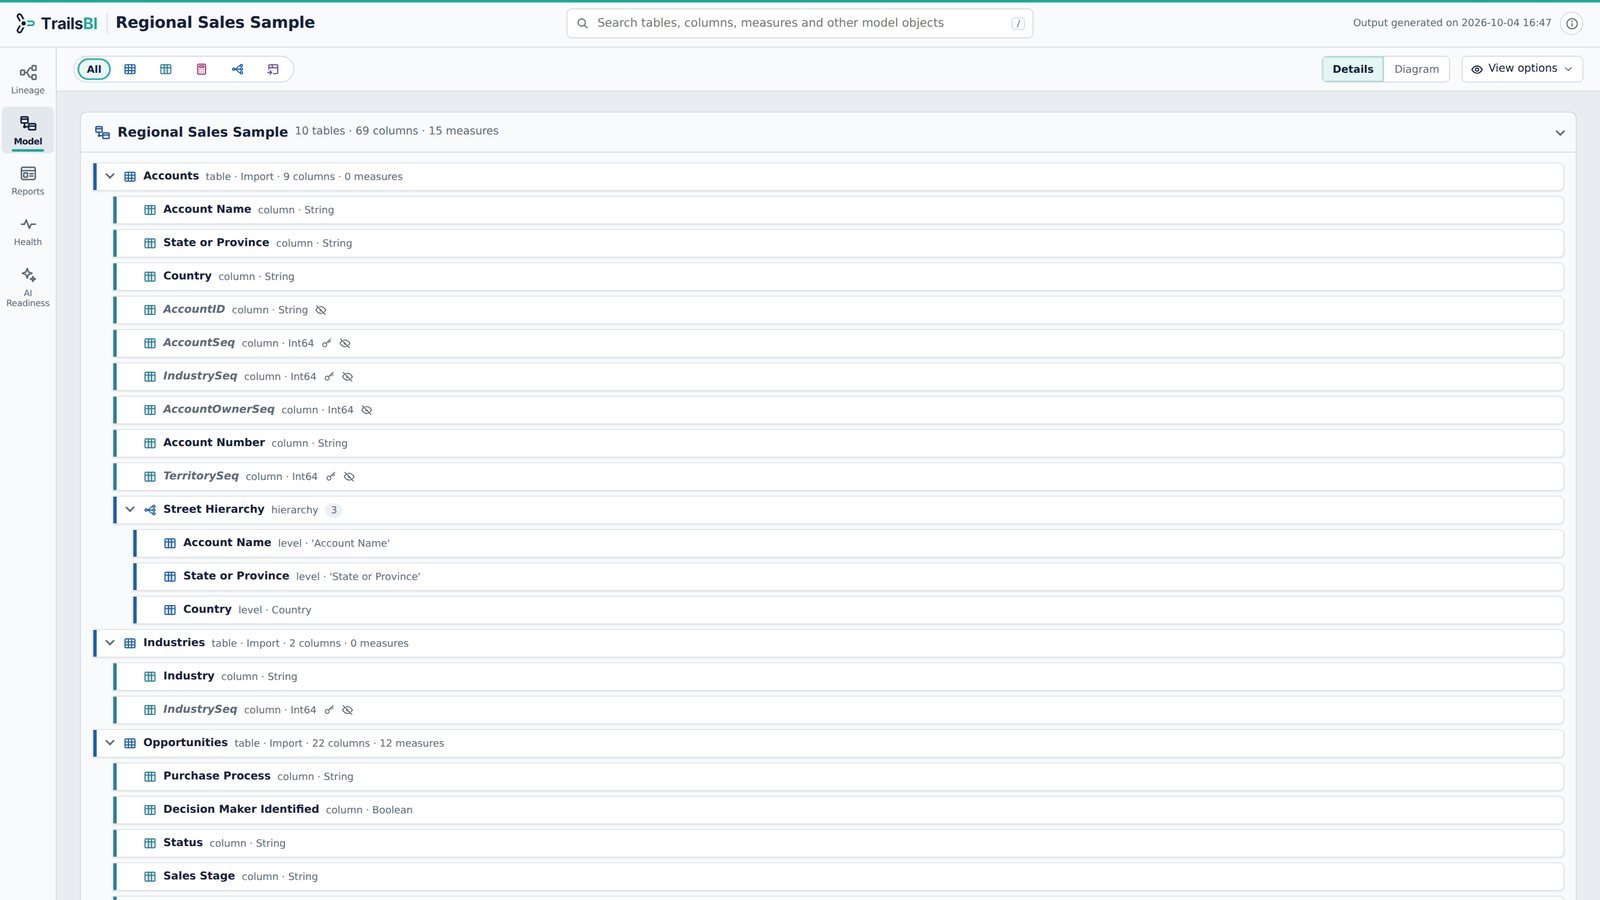
Regional Sales in TrailsBI: Model · Detail View
Model · Detail View. Every table, column and measure. Every table expanded with its columns, measures and hierarchies, keys and hidden objects marked. DAX is one click away and search narrows all of it as you type.
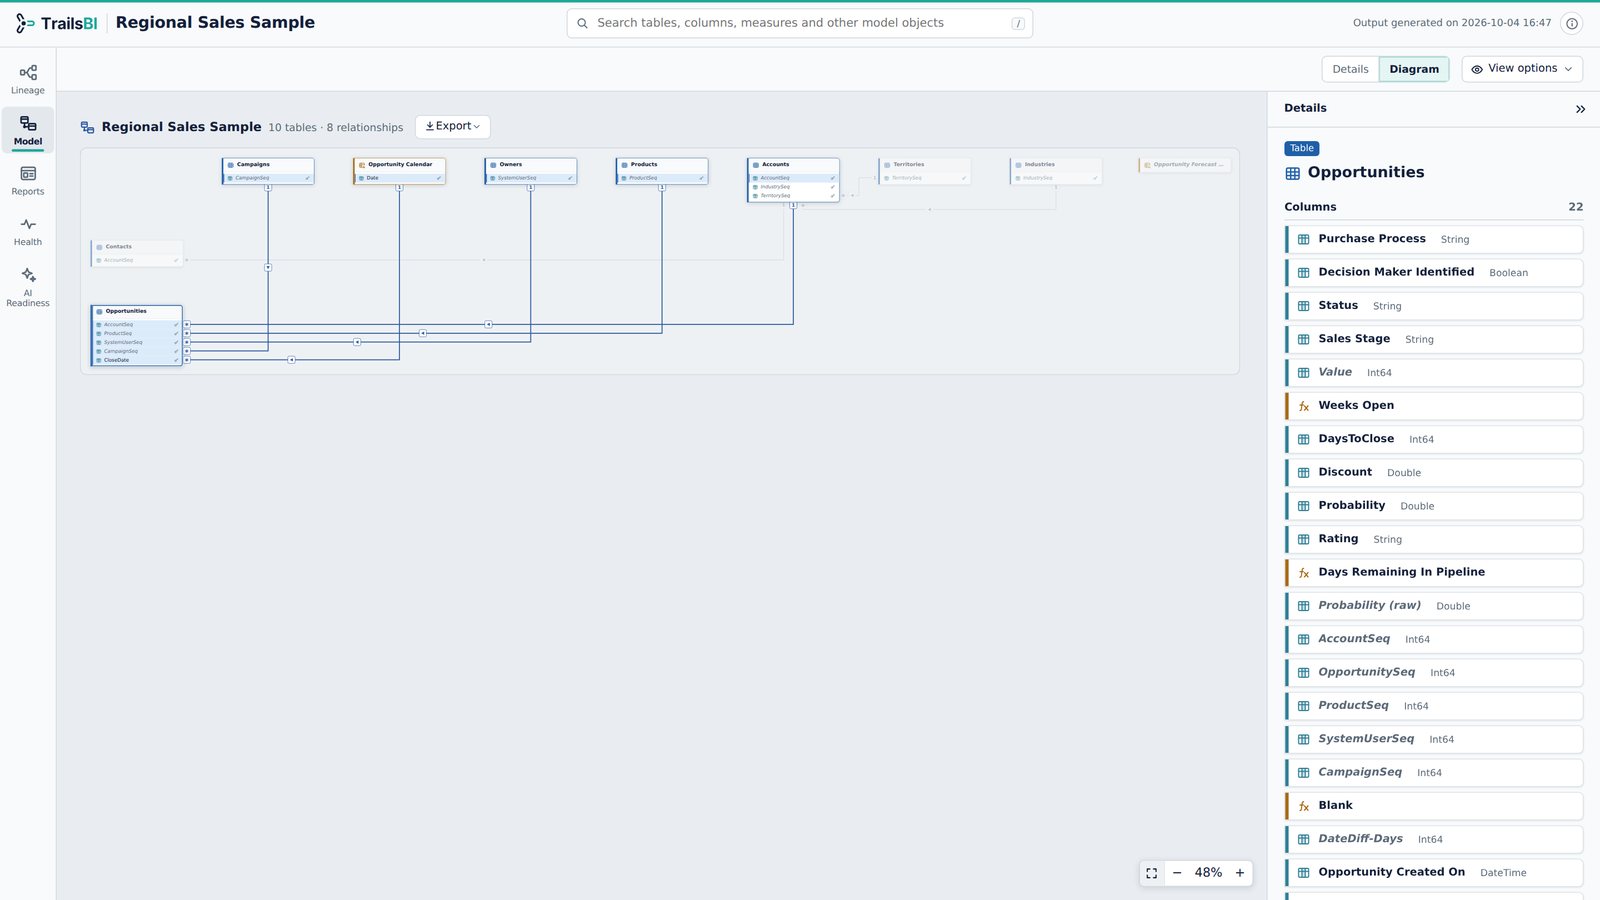
Regional Sales in TrailsBI: Model · Diagram View
Model · Diagram View. Relationships laid out automatically. Opportunities selected: its 5 relationships light up and the Details panel lists its columns and relationships. Opportunities at the centre with accounts, owners, products, campaigns and territories around it.
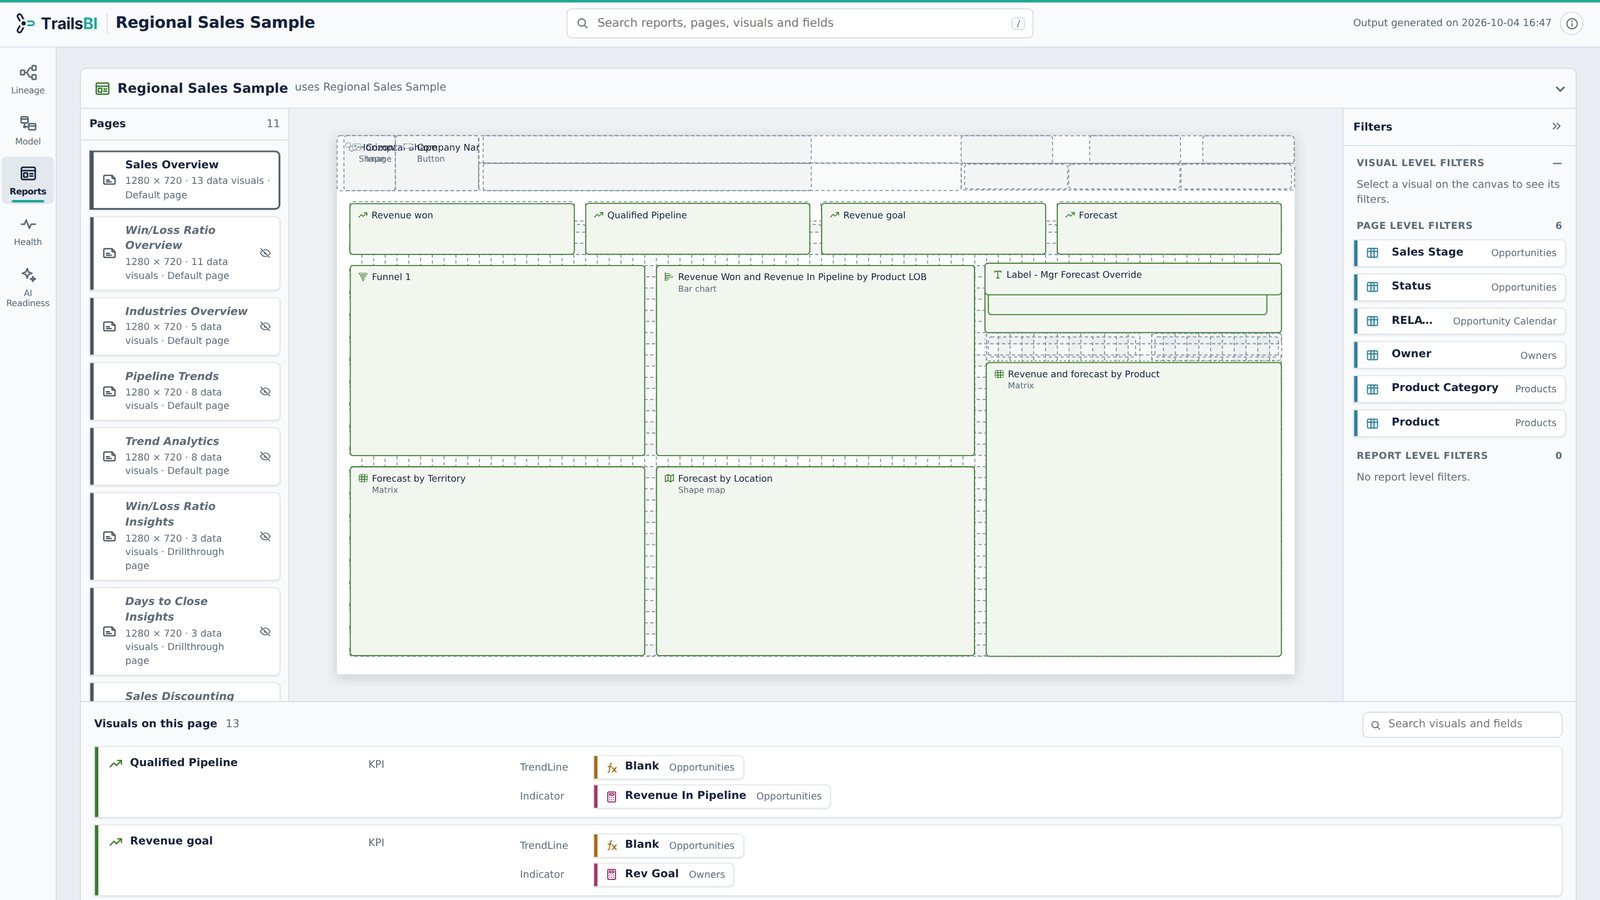
Regional Sales in TrailsBI: Reports View
Reports View. Pages, canvas layout and filters. Sales Overview has 13 data visuals under 68 overlay buttons and 10 shapes. TrailsBI draws the buttons underneath so the charts stay readable.
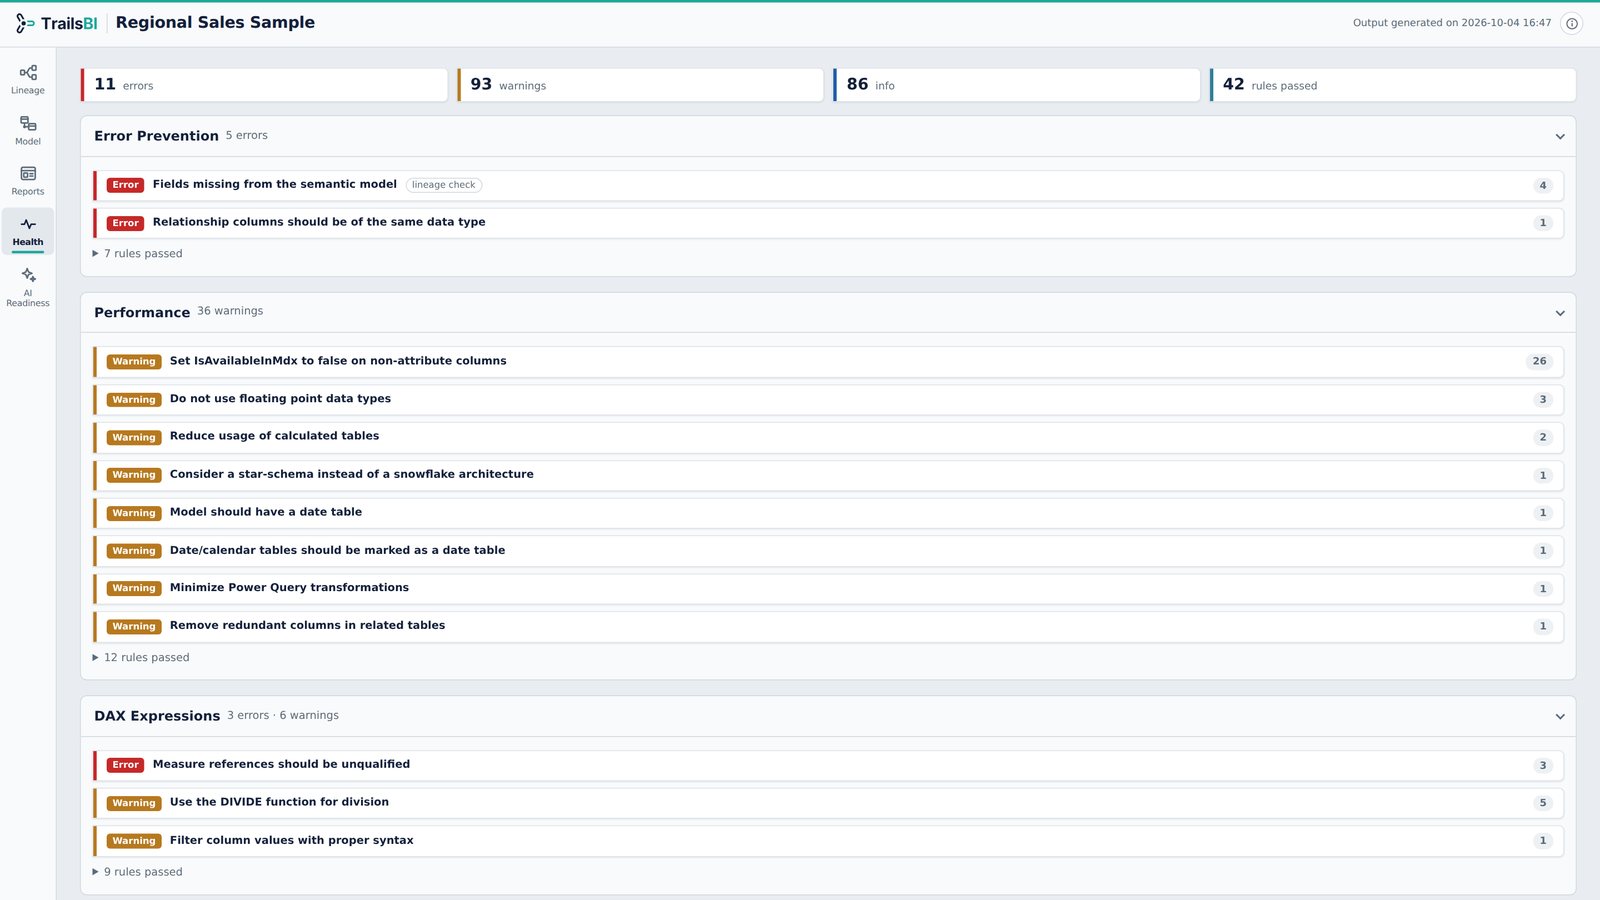
Regional Sales in TrailsBI: Health
Health. Best Practice Analyzer and lineage checks. 11 errors, led by the 4 fields the report uses but the model no longer has.
Regional Sales in TrailsBI: AI Readiness
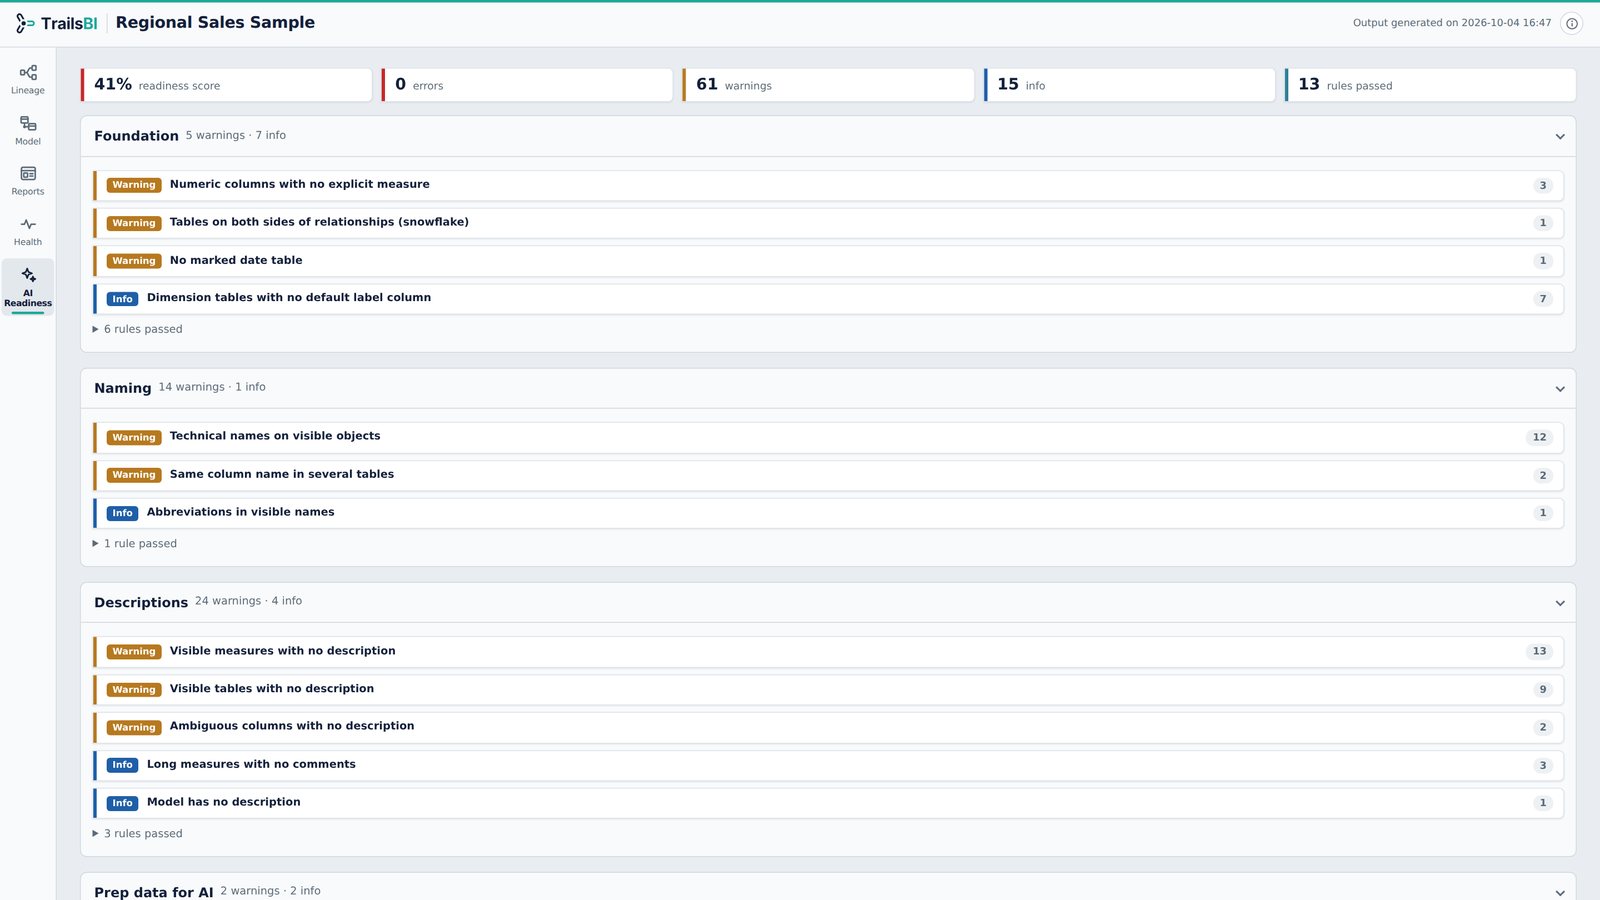
AI Readiness. How ready the model is for Copilot. AI Readiness Score at 41%, with 61 warnings to work through before Copilot sees this model.
Regional Sales in TrailsBI: Exported diagram
Exported diagram. Names visible, or hidden for sharing. The same diagram exported twice: names visible on the left, and on the right with table and column names hidden, safe to share outside the team.