Trails for Power BI
End-to-end Data Lineage, Model Health & AI Readiness for Power BI
One report that maps every source, table, column, measure, visual and page, and tells you what to fix.
pip install trailsbiGetting 'PATH' error on Windows? Setup
Completely Offline Reports. Nothing leaves your machine, ever!
Everything about your Reports and Semantic Models
Click any item in one view to see it in the others. Search finds a name across all of them.
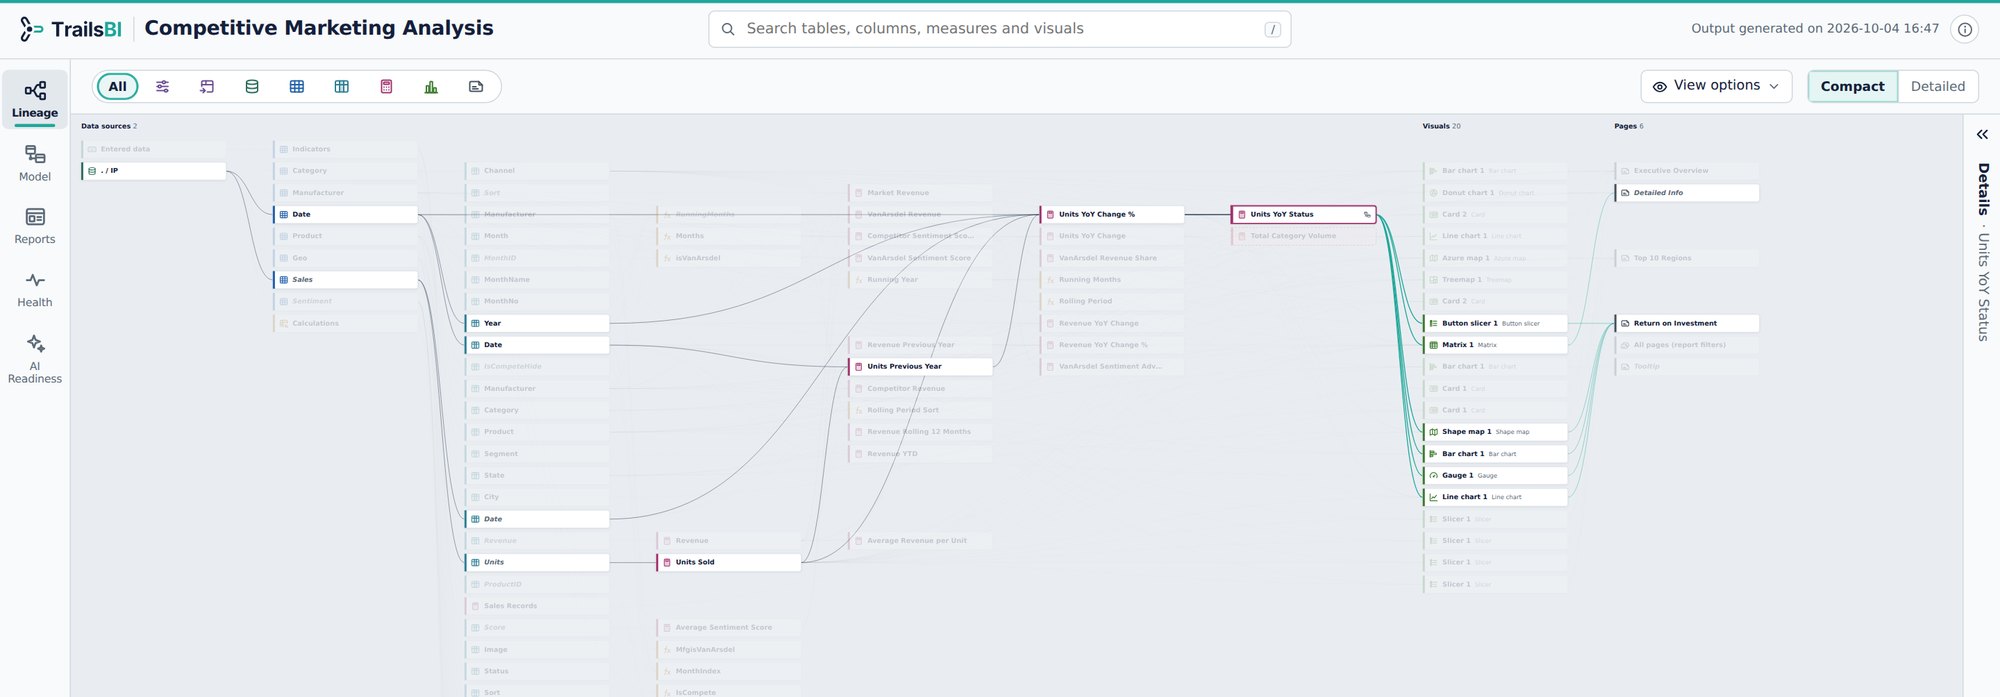
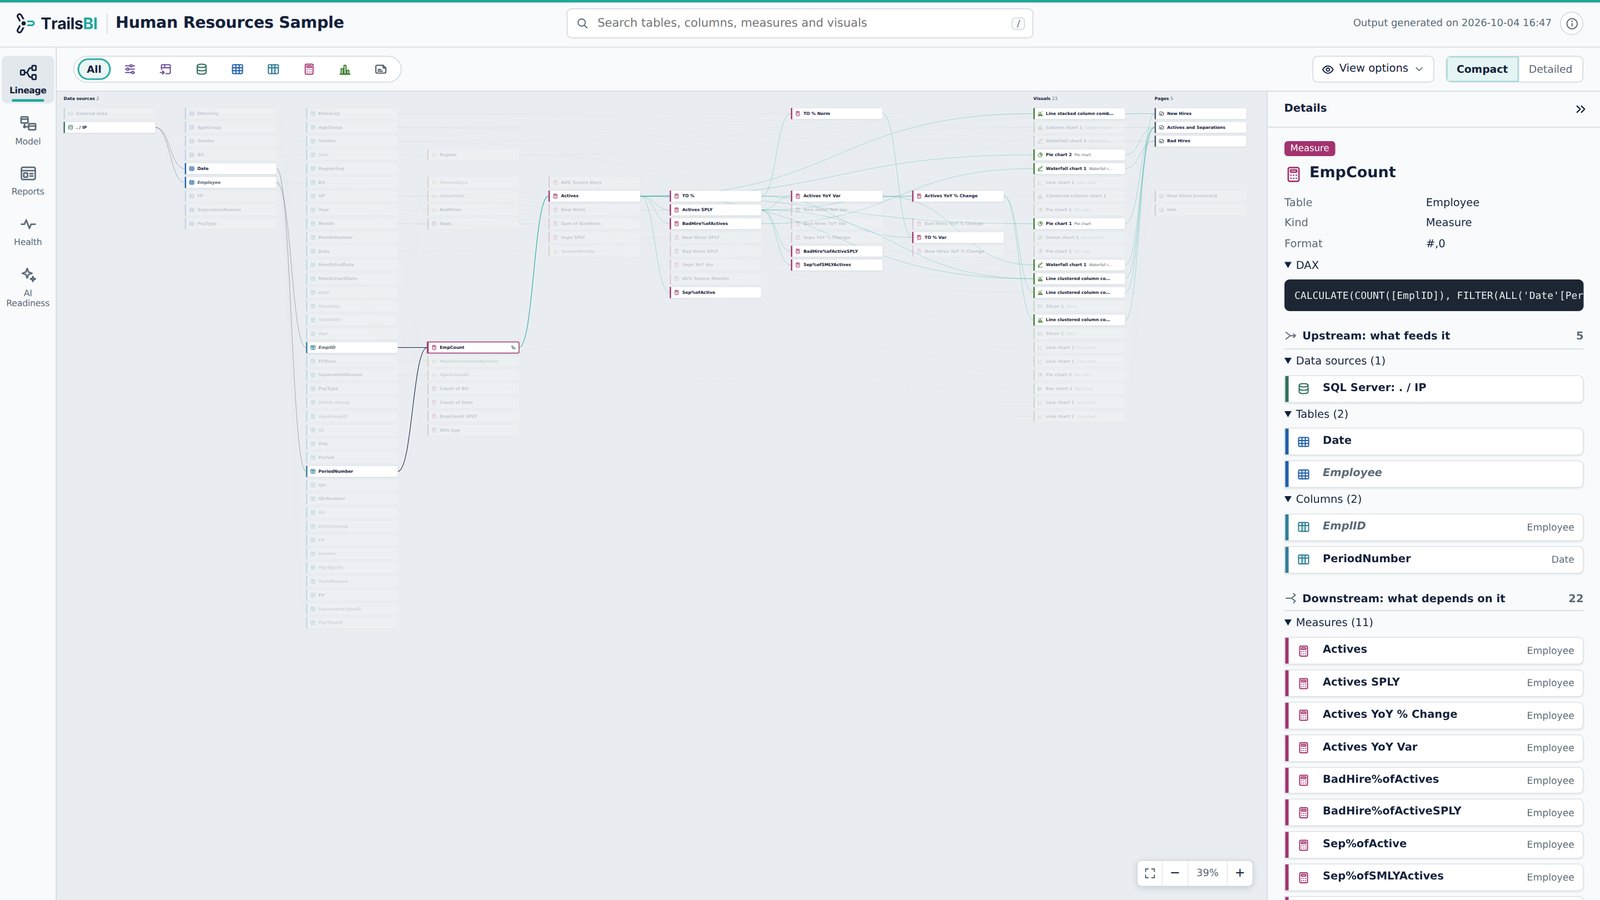
Follow any field from source to visual
- Pick a column or measure and see every data source, table and measure it depends on, in navy.
- Everything built on it, down to the visuals and pages, lights up in teal.
- Compact cards for the whole picture, detailed cards with usage counts when you need them.
- Calculation groups get cards of their own, with the measures each item can change.
- Switch to Graph to see the whole project in one pictures.
- Measures a live-connected report adds itself show apart from the model's own.
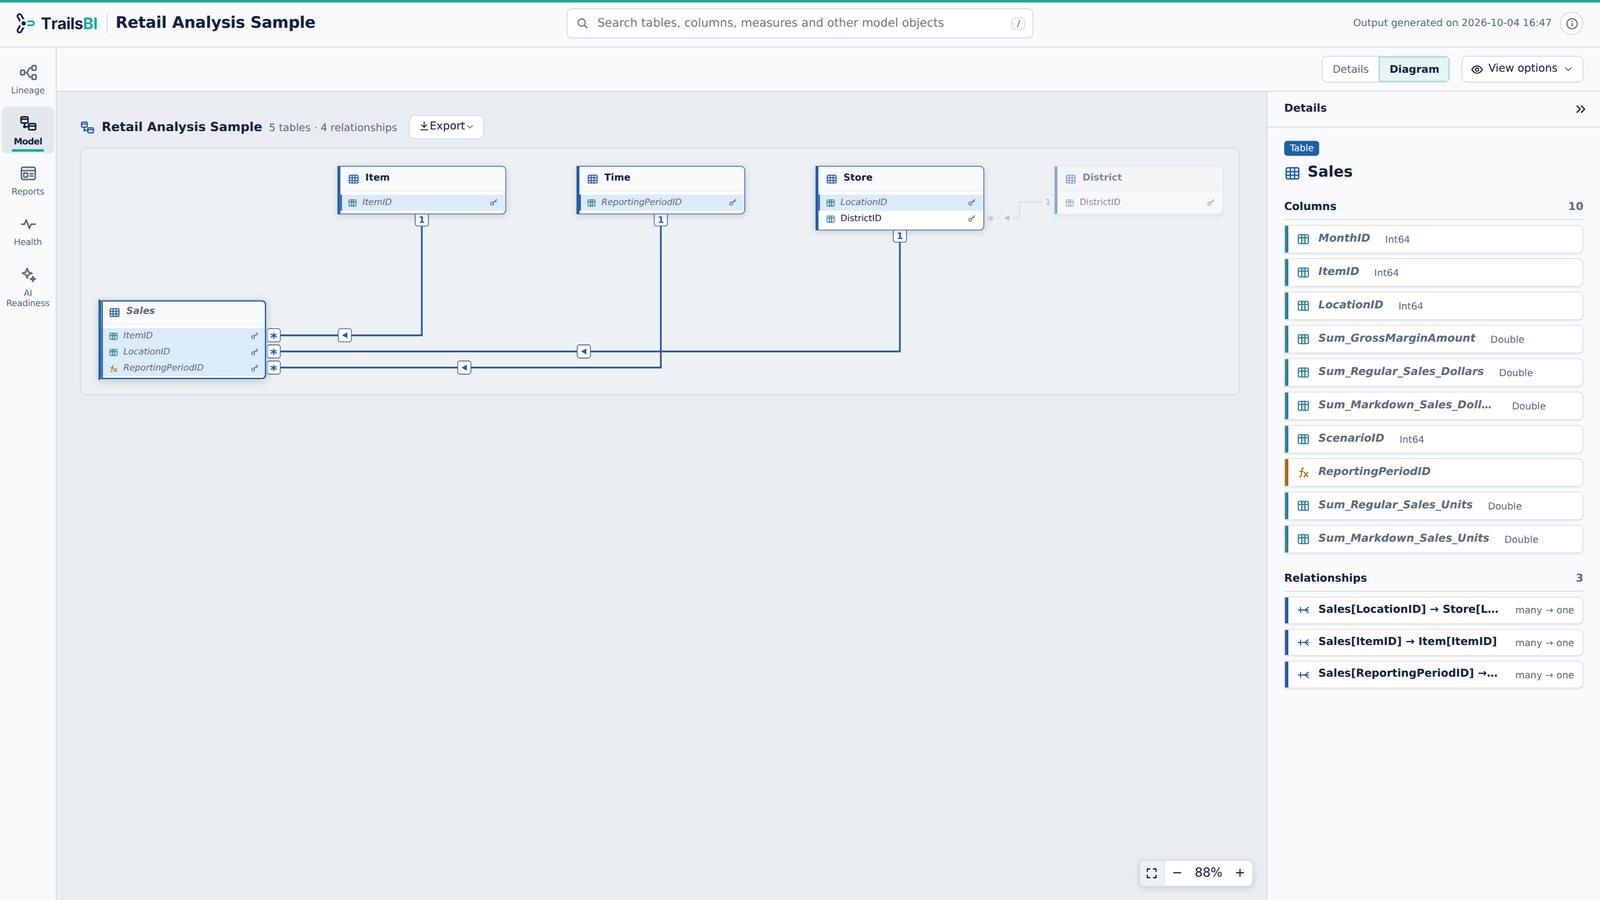
Every table, column, measure and relationship
- A searchable list of the whole model with DAX and Power Query one click away. Point at any function for what it does.
- A relationship diagram laid out for you, with cardinality and filter direction on every line.
- Export the diagram as PNG or SVG, with table and column names hidden when you share it.
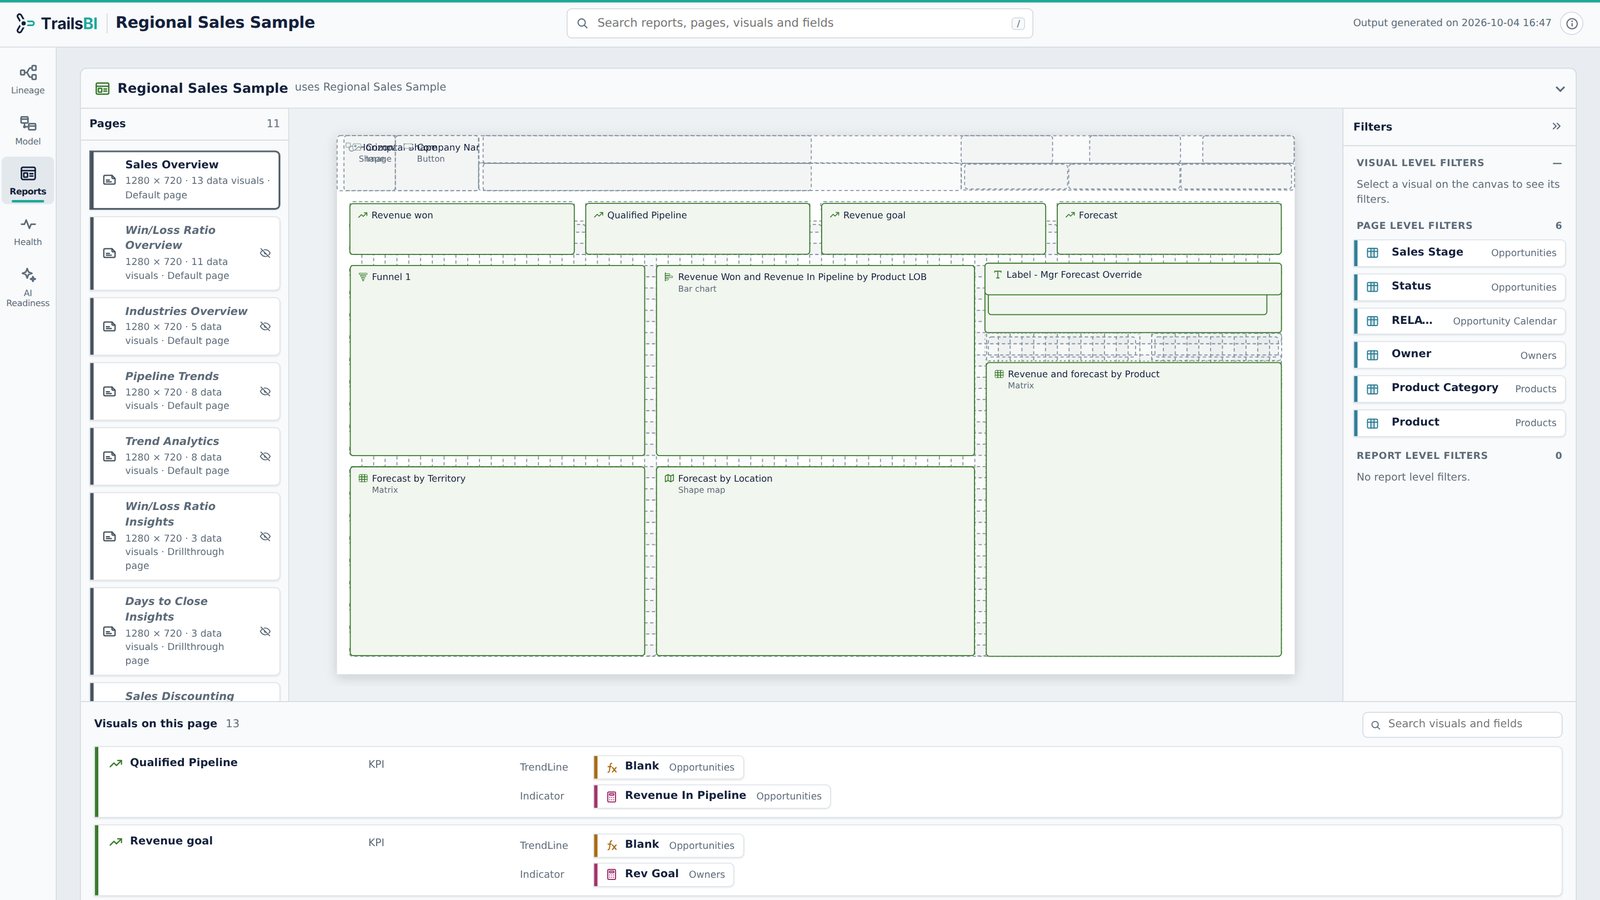
What each page and visual actually uses
- Every page drawn as a canvas preview, with page, report and visual-level filters.
- Each visual lists its fields by role: values, axis, legend, sort, filters and formatting.
- Fields a visual uses but the model no longer has are flagged before your users find them.
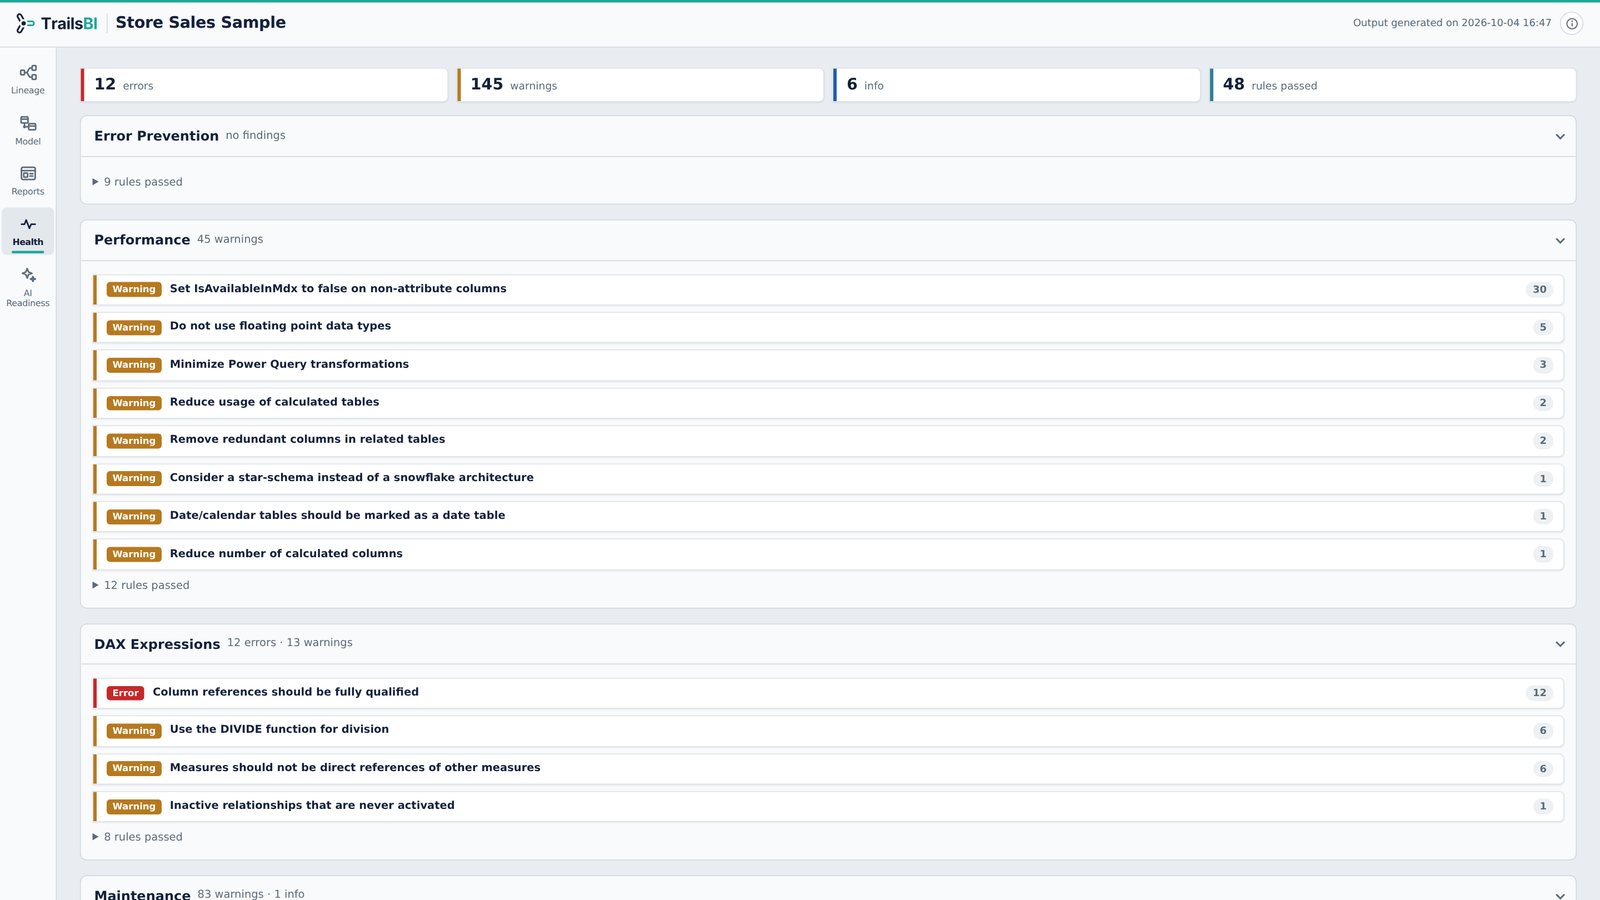
Best Practice Analyzer, without the setup
- Microsoft's Best Practice Analyzer rules, run straight from the TMDL files.
- Lineage checks on top: unused columns, measures and calculation groups, broken references, missing sort fields.
- Measures count toward their home table, so a measures table is never suggested for deletion.
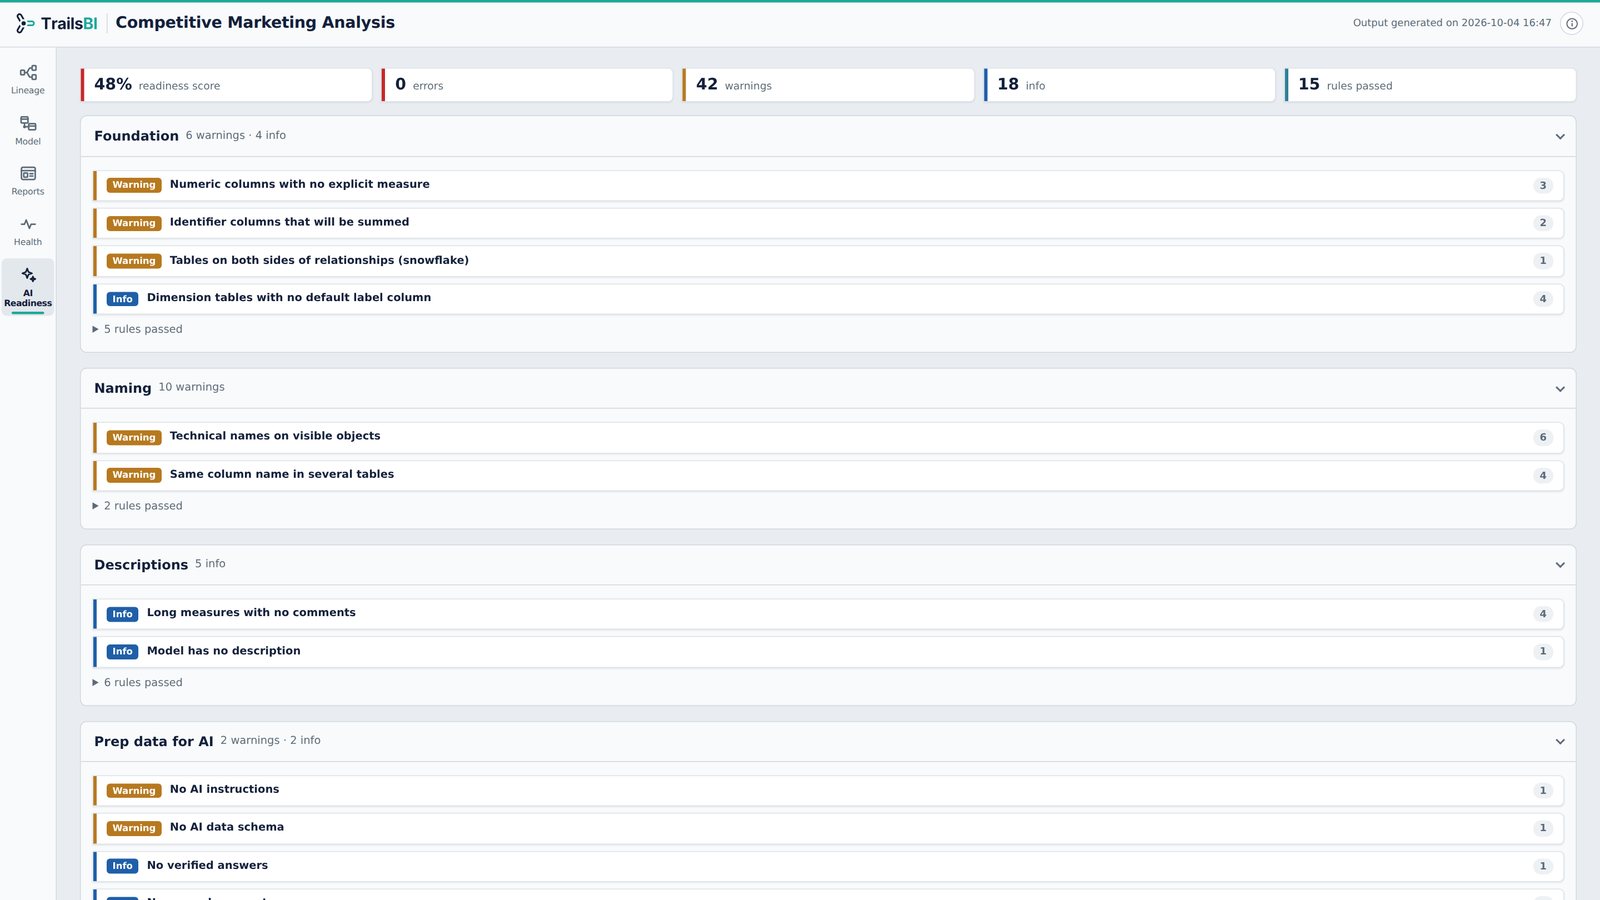
A score for how well Copilot will understand the model
- Checks the foundations Copilot relies on: Q&A enabled, explicit measures, a star schema, a marked date table.
- Then naming, descriptions and AI instructions, grouped so you can work through them in order.
- One score from 0 to 100%, and each finding lists the tables, columns and measures it is about.
See it inside Power BI
The TrailsBI visual puts all five views on a page of your report, so you can check lineage and health without leaving Power BI.
- One command sets it up:
--embedadds a TrailsBI page to your report with the visual already on it. Nothing to import. - The same Lineage, Model, Reports, Health and AI Readiness views, fully interactive. Switch each one on or off in Format visual, Pages.
- Runs in Power BI's visual sandbox with no network calls. Its data is a hidden table in your model.
The TrailsBI page is hidden from report readers, but the table holds your model's names, DAX and data source addresses, and anyone who can edit or build on the report can read them. Embed it only where that is allowed.
- Update TrailsBI to 1.4 or later
pip install -U trailsbi - Close the project in Power BI Desktop, then embed
trailsbi "your-pbip-project-path" --embed - Open, refresh, and go to the TrailsBI pageOpen the project and refresh (Home, Refresh). The visual is already on the page, hidden from report readers. Run
--embedagain after changes to the model or report.
Now it's your turn
Start Analyzing your own Reports and Semantic Models.
Runs entirely on your machine: no sign-in, no upload, and the package has no dependencies beyond Python.
Getting 'PATH' error on Windows? Setup
- Save as PBIPIn Power BI Desktop: File, Save as, Power BI project (.pbip).
- Install TrailsBI
pip install trailsbi - Run it on your project
trailsbi "your-pbip-project-path"